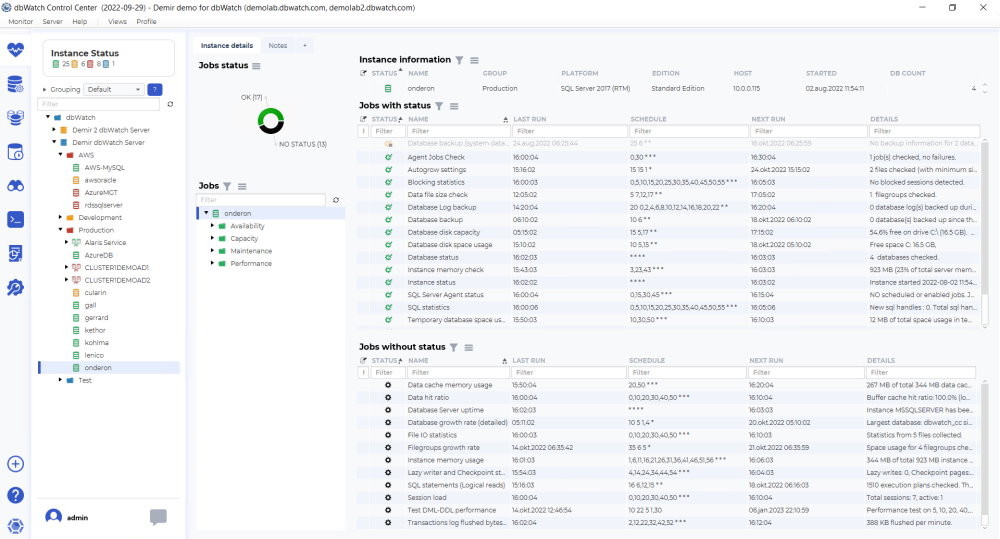
When navigating to an individual database instance, you get the instance details overview:

This dashboard is intended to give an overview of what monitoring jobs are installed and how they are performing.

The top tabs let you switch between the instance details overview and the notes overview. The notes overview shows all notes on the instance and the jobs on that instance.

Underneath the top tabs is the jobs status piechart. This allows you to quickly see how many enabled jobs are in what status.

The jobs tree allows you to navigate to the individual jobs. The jobs are grouped together, in groups like Availability, Capacity, Maintenace, and Performance.

On top we have the instance information table, with the fields “Instance note indicator”, “Status”, “Name”, “Platform”, “Edition”, “Host”, Started” and “DB count”.
The “Instance note indicator”, will show an icon when someone has created a note on this instance. Notes are used to store permanent and semi-permanent information about a database instance.
The “Status” icon, indicates the current worst status of the jobs on this database instance.
The “Name” field, is the name you have given to the database instance when adding it to dbWatch. This can be changed and adjusted later.
The “Platform” field, is the database type and version.
The “Edition” field, is the database edition type.
The “Host” field, is the hostname or IP address configured.
The “Started” field, is the last time this database instance has started up.
The “DB count” field, is the current database count in this database instance.

Jobs in Control Center monitor a specific metric and can also store historical data, that is later utilized in reports and dashboards.
We distinguish between jobs with status and jobs without status. Jobs with status are jobs that monitor a metric that also creates warnings and alarms.
The jobs with status overview have the fields “Job note indicator”, “Status”, “Name”, “Last run”, “Schedule”, “Next run”, and “Details”.
The “Job note indicator”, will show an icon when someone has created a not on this job on this instance. Notes on jobs are used to store permanent and semi-permanent information about a job on a database instance, such as known issues and problems.
The “Status” icon indicates severity, yellow for warnings, and red for alarms. If there is a black x on the icon, this indicates unacknowledged historical alarms or warnings.
The “Name” is the name of the monitoring job that has found an issue. The jobs are named descriptively so it should be easy to understand what metric they are monitoring.
The “Last run” field is the time this job was run last.
The “Schedule” field is the current schedule for this job.
The “Next run” field indicates the next time this monitoring job is scheduled to run.
The “Details” field is used to show an error message regarding the problem detected. More in-depth information is available if you right-click on the issue line, and choose details.

The jobs without status are used to gather historical or trend data about a metric. They provide their own report and are also used to provide data for reports historical data for management.
The jobs without status overview have the fields “Job note indicator”, “Status”, “Name”, “Last run”, “Schedule”, “Next runtextileRef:12138492526751f24dd4de6:linkStartMarker:”, and “Details”.
The “Job note indicator”, will show an icon when someone has created a not on this job on this instance. Notes on jobs are used to store permanent and semi-permanent information about a job on a database instance, such as known issues and problems.
The “Status” icon in jobs without status is always black.
The “Name” is the name of the monitoring job that has found an issue. The jobs are named descriptively so it should be easy to understand what metric they are monitoring.
The “Last run” field is the time this job was run last.
The “Schedule” field is the current” schedule”:https://wiki.dbwatch.com/ControlCenter/1.0/en/topic/jobs-schedule for this job.
The “Next run” field indicates the next time this monitoring job is scheduled to run.
The “Details” field is used to show an error message regarding the problem detected. More in-depth information is available if you right-click on the issue line, and choose details.
We can also go into” further details for each job. “:https://wiki.dbwatch.com/ControlCenter/1.0/en/topic/job-details


Post your comment on this topic.