Edit Report Templates
Report Selection
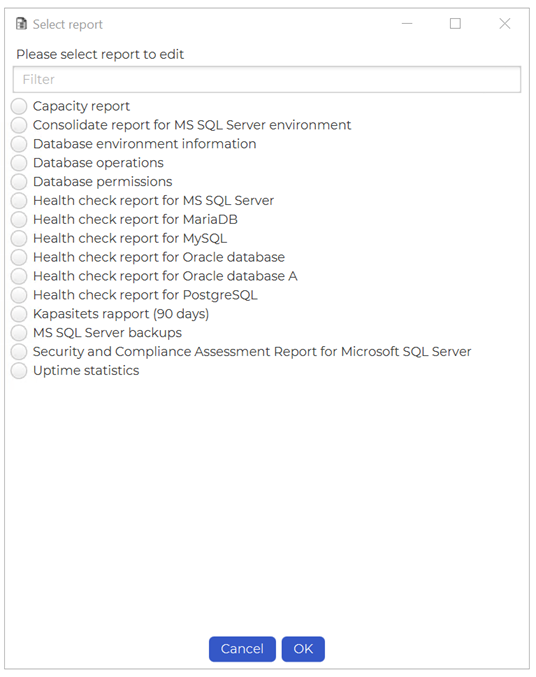
When you go to main menu “Server” → “Reporting” and then select “Edit Report Template”, you will see a list of all available report templates. Select the report template you wish to edit and click “OK”.
Report properties
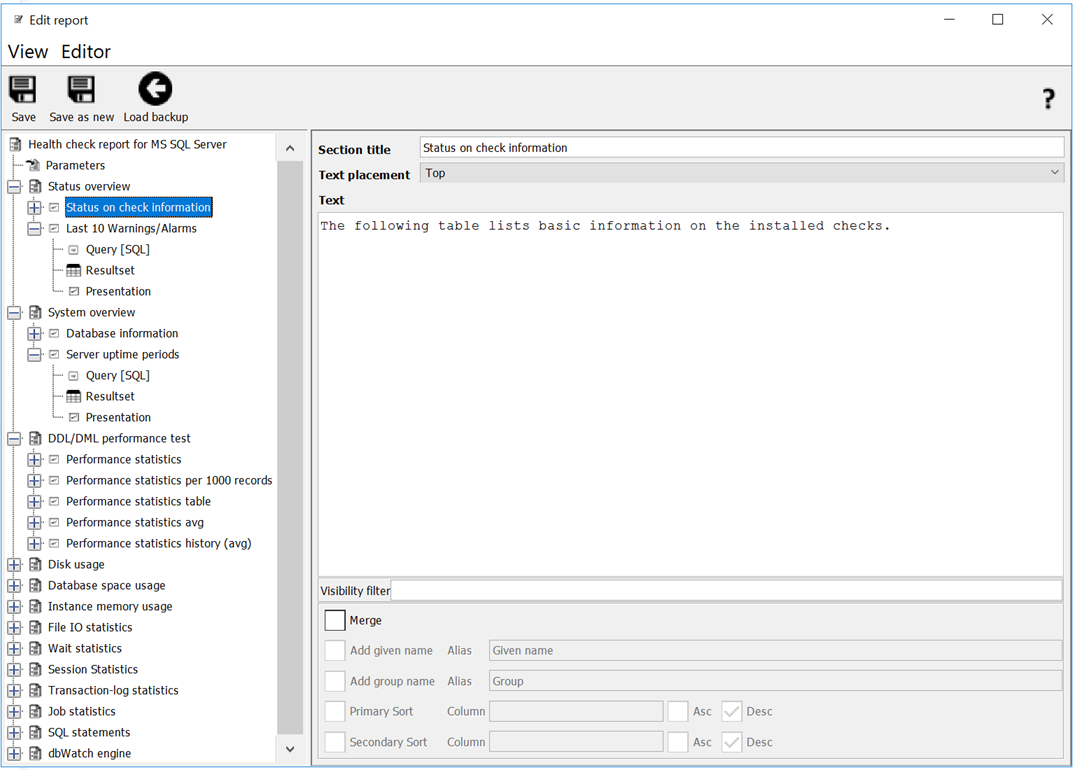
You will now see the main view of Report Editor. On the left side you see a tree structure giving you access to the metadata/properties and the various chapters and sections in the report.
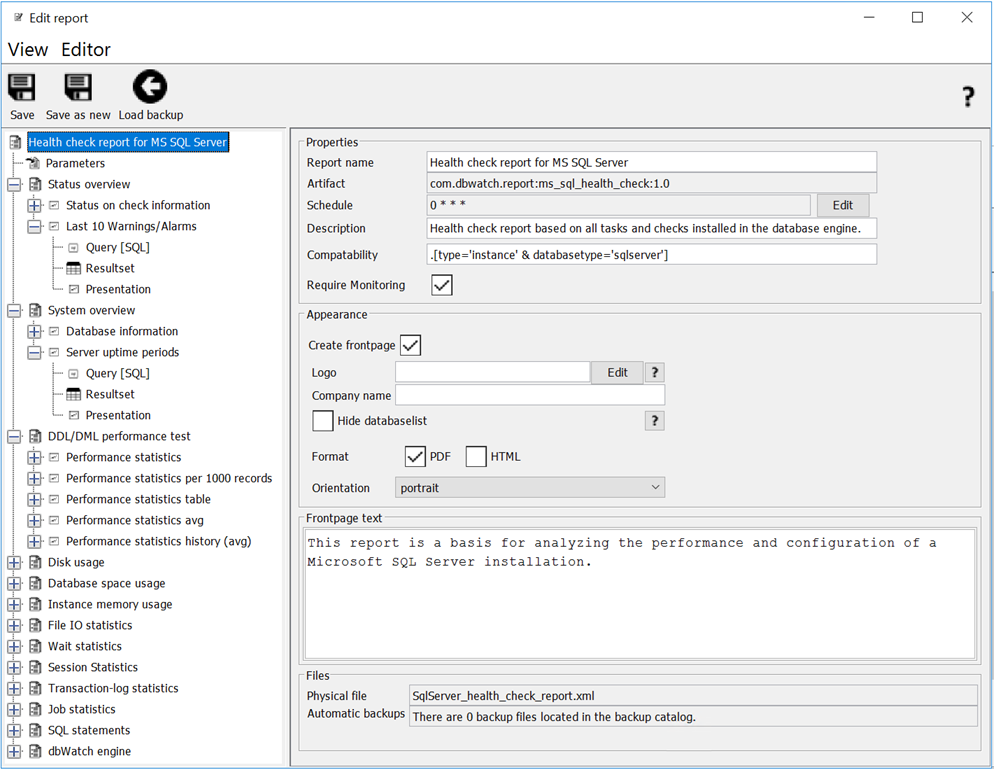
When the top node in the tree is selected you see 3 views on the left side, Properties, Appearance and Frontpage text as well as, the physical location of the report template file and where the automatic backups are placed.
Report Properties
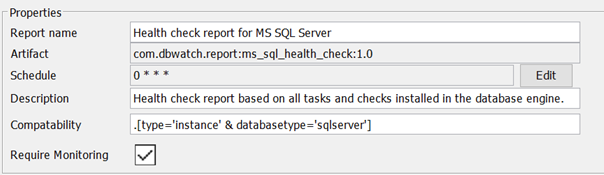
In the Propterties section you can specify the report name, the default schedule, a short description and the compatability for the report.
Report Appearance
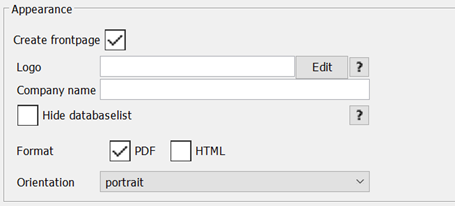
In the Appearance section you can specify a custom logo and company name for the report (which will appear on the frontpage of the report).
The “Hide databaselist” checkbox allows you to specify that the list of which database instances this report is generated for should not be shown. (This is normally page two of the report).
Format lets you choose the between PDF and HTML as the default format for this report.
And finally “Orientation” lets you specify if the report is in portrait or landscape mode by default.
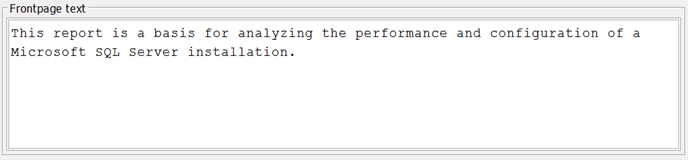
Report Frontpage Text
This is the text that will appear on the frontpage of the report.
Chapter
A report can be divided into several chapters, each containing one or more sections.
Section
When you click on a section, you can edit basic information such as the title and a text that will appear at the start of the section. There is also a panel that lets you specify whether the section should be a Merged section.
Merged section
A Merged section controls how the section is presented when multiple instances are selected:
- - Merged: all selected instances are combined into a single presentation.
- - Not merged: the section is presented once per instance, individually.
Visibility Filter
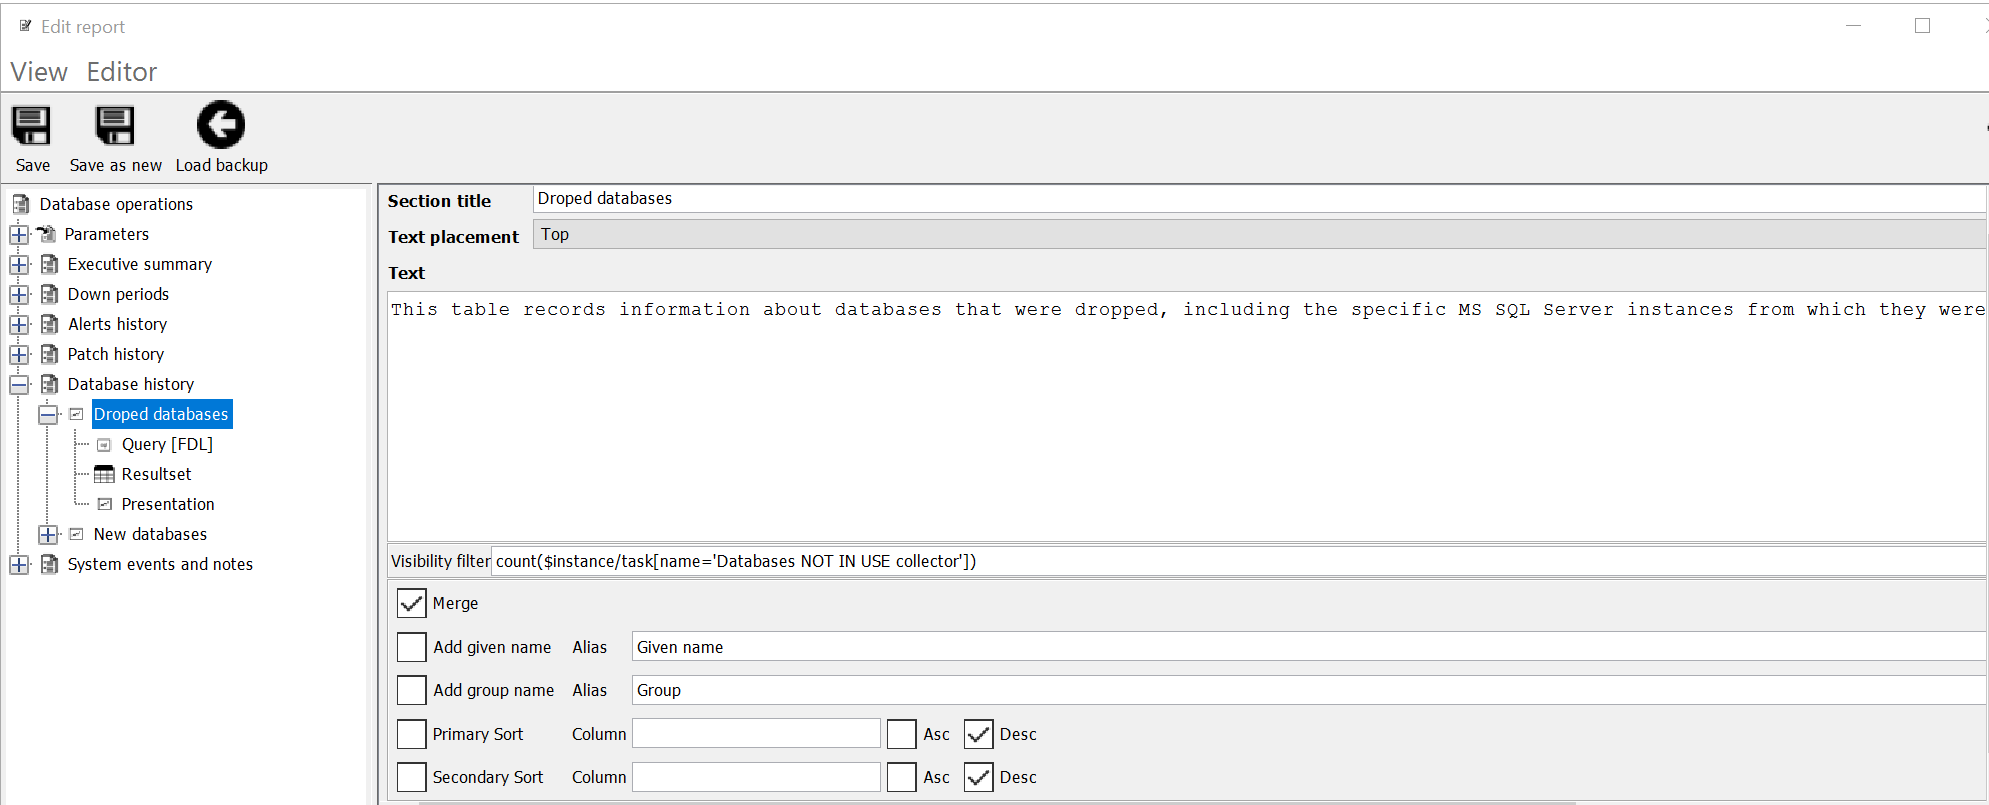
The Visibility filter allows you to control whether a section should be included for each selected instance when the report is generated.
The expression you enter is evaluated individually for every instance. If the expression returns 0 or false, the section is not shown for that instance. This prevents empty or irrelevant sections from appearing in the final report.
- Example:
For the “Dropped databases” section, the section should only appear when the instance has results from the task “Databases NOT IN USE collector”.
To achieve this, the following visibility filter can be used: count($instance/task[name=‘Databases NOT IN USE collector’])
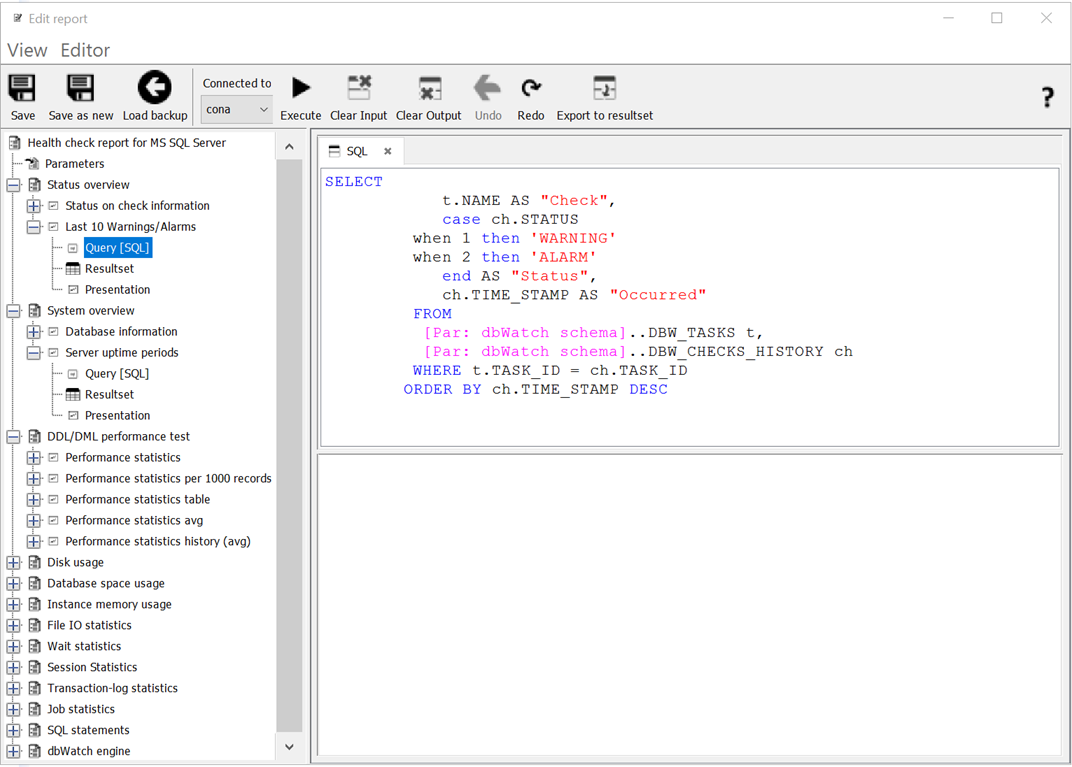
Query
Each section defines an sql query that retrieves the data used to create a presentation.
The task editor allows you to execute the query to verify that it has the correct syntax and that it returns the data you expected.
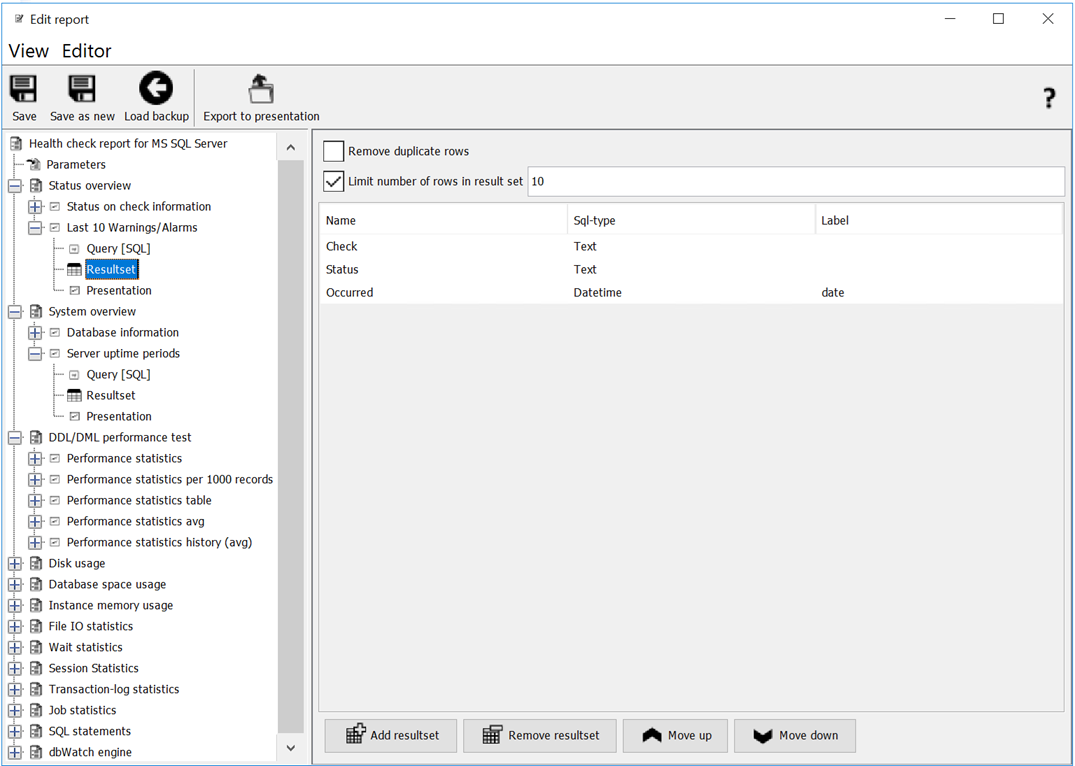
Resultset
When you click on Resultset you see a definition of the colums and datatypes the query produces. If this is empty, you can click on “Export to resultset” in the query view after you have generated a sample resultset by executing the query, and the resultset definition will be automatically genereated.
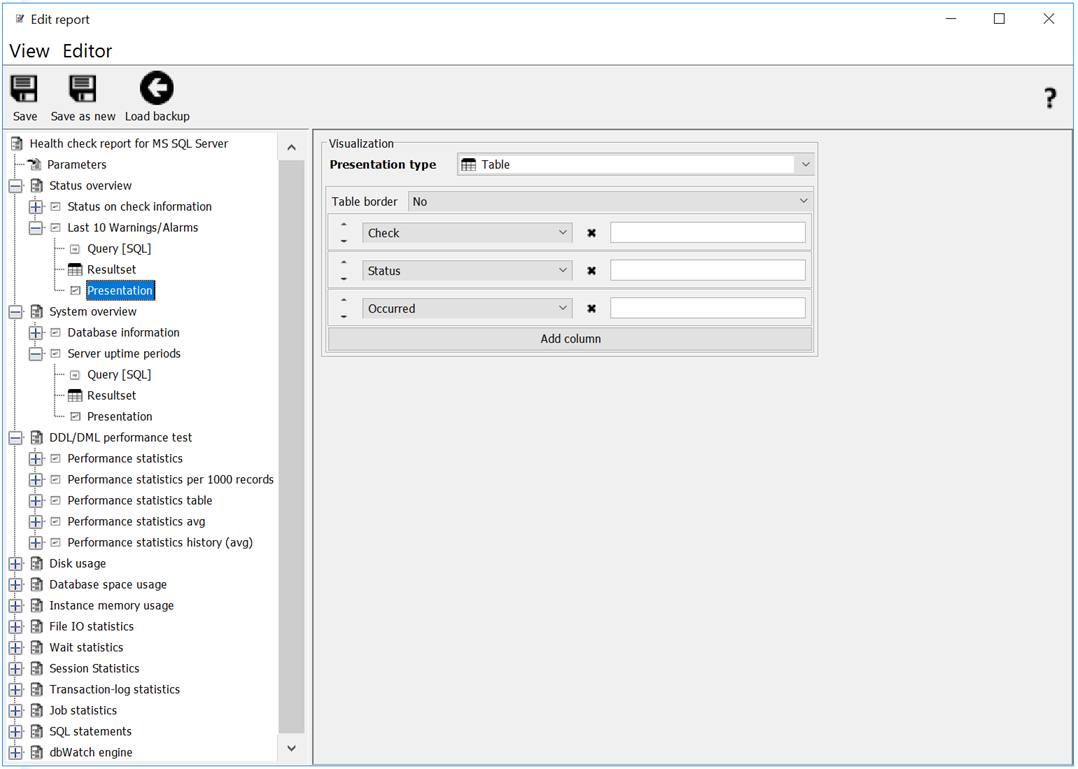
Presentation
When you click on Presentation you can define how you want the result presented. The available presentation types are: Table, List, Category Chart – Series, Category Chart, Pie Chart and Dual Axis Chart