Monitoring
In this section, we’ll be familiarized with how the Monitoring Module works.
When opening the monitoring module on its initial state, you get the status dashboard:

The status dashboard is intended to provide a quick overview of the current state of your database instance environment.
 The monitoring dashboard has tabs on the top, to switch between the dashboards.
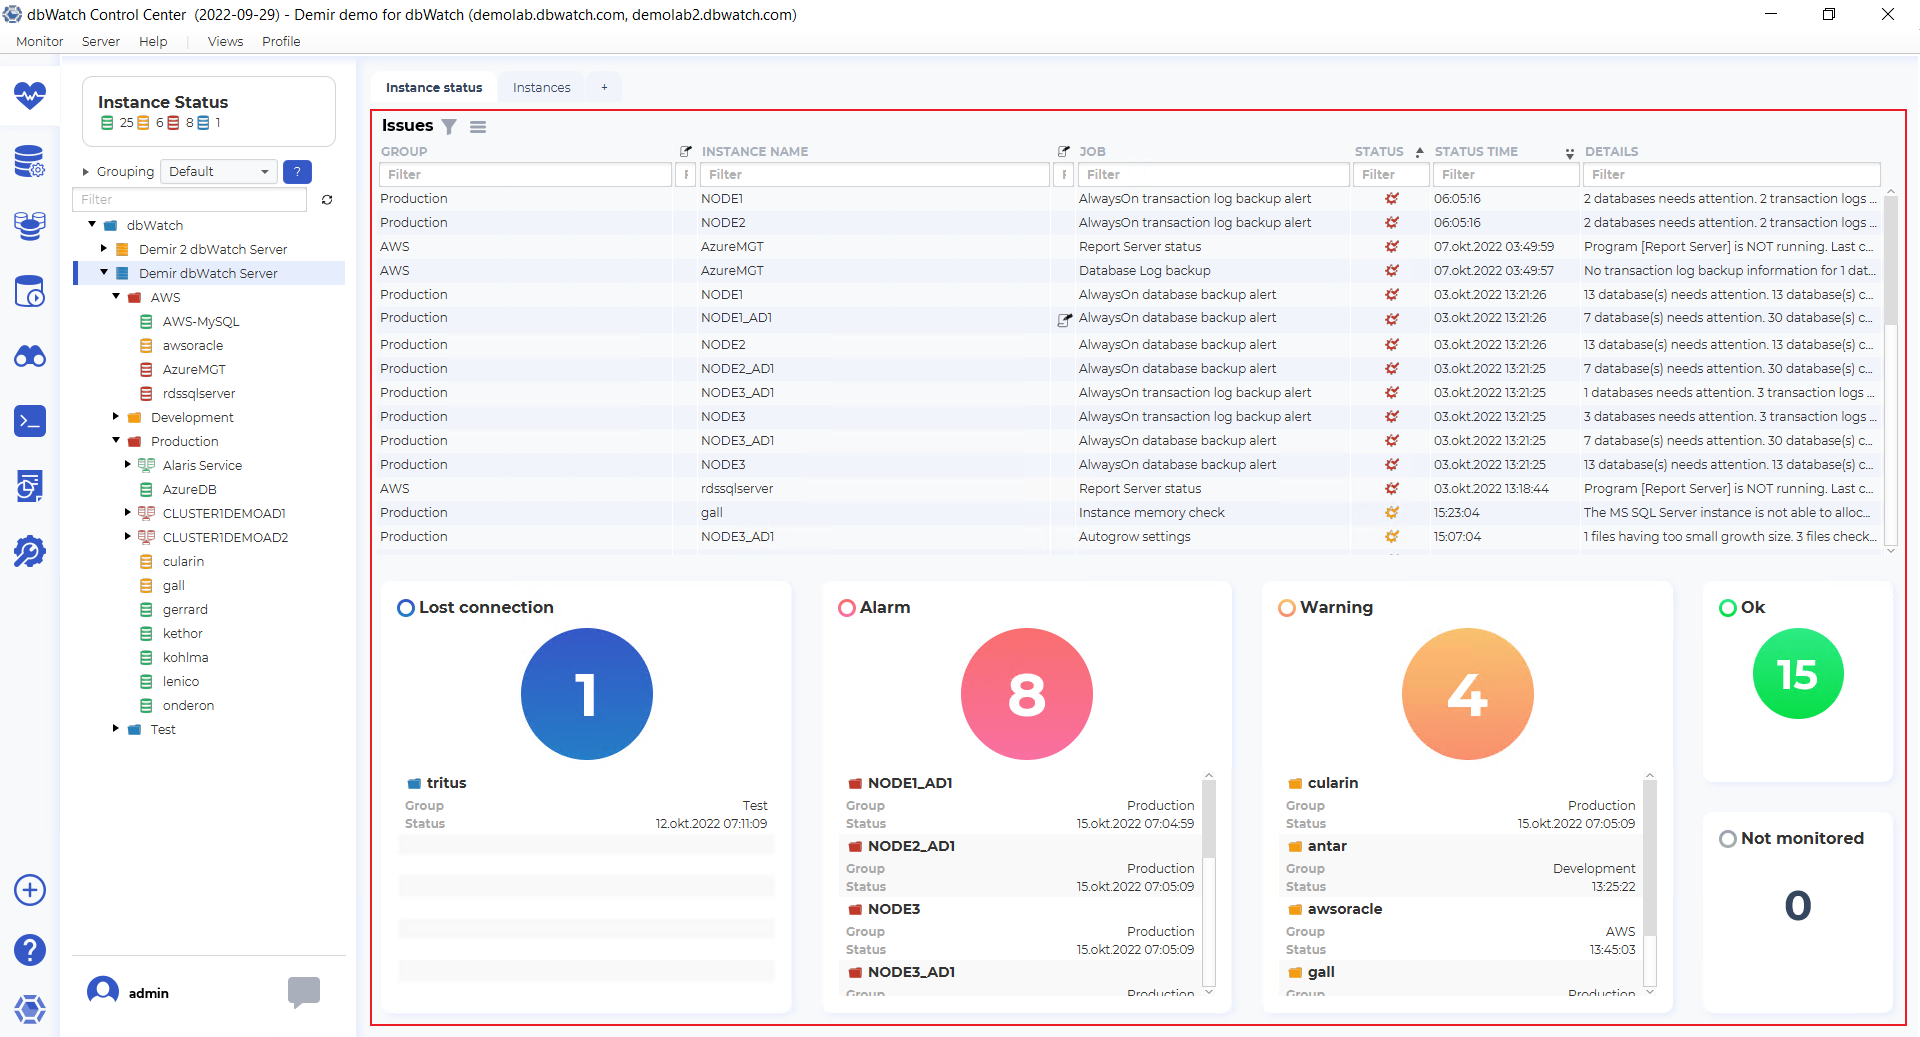
The issue list dashboard has issues from the instances under the currently selected point the tree structure.
The issue list has the fields “Group”, “Instance note indicator”, “Instance name”, “Job note indicator”, “Job”, “Status”, “Status time” and “Details.”
| Field | Description |
|---|---|
| Group | The group you have put the instance into. By default we ship with groups “Development”, “Test”, and “Production”, this is, however, user-configurable. |
| Instance Note indicator | Will show an icon when someone has created a note on this instance. Notes are used to store permanent and semi-permanent information about a database instance. |
| Instance name | The name you have given to the database instance when adding it to dbWatch. This can be changed and adjusted later. |
| Job Note Indicator | Will show an icon when someone has created a not on this job on this instance. Notes on jobs are used to store permanent and semi-permanent information about a job on a database instance, such as known issues and problems. |
| Job | The name of the monitoring job that has found an issue. The jobs are named descriptively so it should be easy to understand what metric they are monitoring. |
| Status | Icon that indicates severity, yellow for warnings, and red for alarms. Only warnings and alarms will show up in this overview. |
| Status time | Will tell you at what time the job got its current status. |
| Details | Show an error message regarding the problem detected. More in-depth information is available if you right-click on the issue line, and choose details. |
Underneath the issue list, there are balls indicating the number of instances in each status, with a list of instance names, groups, and status change times. Blue ball is for “Lost connection”, red is for “Alarm”, yellow is for “Warning”, green is for “Ok” and if you have added instances without monitoring, they are in the “Not monitored” section.
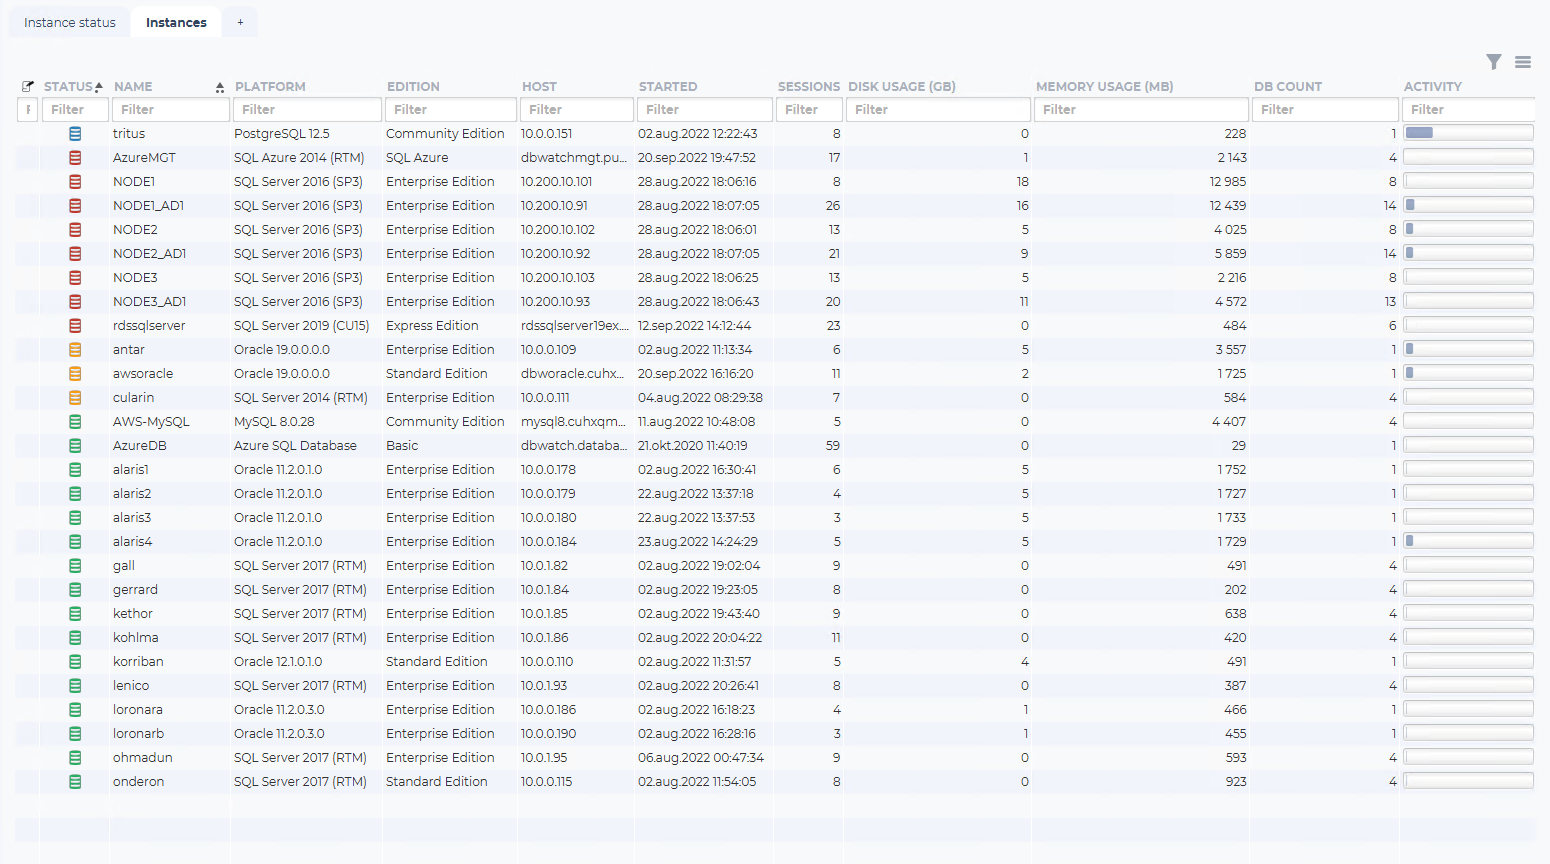
The “Instances” list the instances connected in a table format.
The fields are “Instance note indicator”, “Status”, “Name”, “Platform”, “Edition”, “Host”, Started”, “Sessions”; “Disk usage (GB)”, “Memory usage(MB)”, “DB count” and “Activity” bar.
| Field | Description |
|---|---|
| Note indicator | Will show an icon when someone has created a note on this instance. Notes are used to store permanent and semi-permanent information about a database instance. |
| Status | Will show an icon representing the status of the instance. |
| Name | The name you have given to the database instance when adding it to dbWatch. This can be changed and adjusted later. |
| Platform | The database type and version. |
| Edition | The database edition type. |
| Host | The hostname or IP address configured. |
| Started | The last time this database instance has started up. |
| Sessions | The current number of sessions connected to this database instance. |
| Disk usage (GB) | The current disk usage by this database instance in GB. |
| Memory usage (MB) | The current memory usage by this database instance in MB. |
| DB count | The current database count in this database instance. |
| Activity bar | A calculated compound metric estimating the current activity load on this database instance. |
You can use the tree structure to navigate to a database instance to get into the overview of what monitoring jobs are running on that instance.