Using SQL Performance package on PostgreSQL
Navigating to the SQL Performance package dashboard
Once the SQL statistics job is installed and have collected data, you can navigate to the dashboard.
It is located in the management interface for that database instance. The pictures and descriptions are from PostgreSQL.
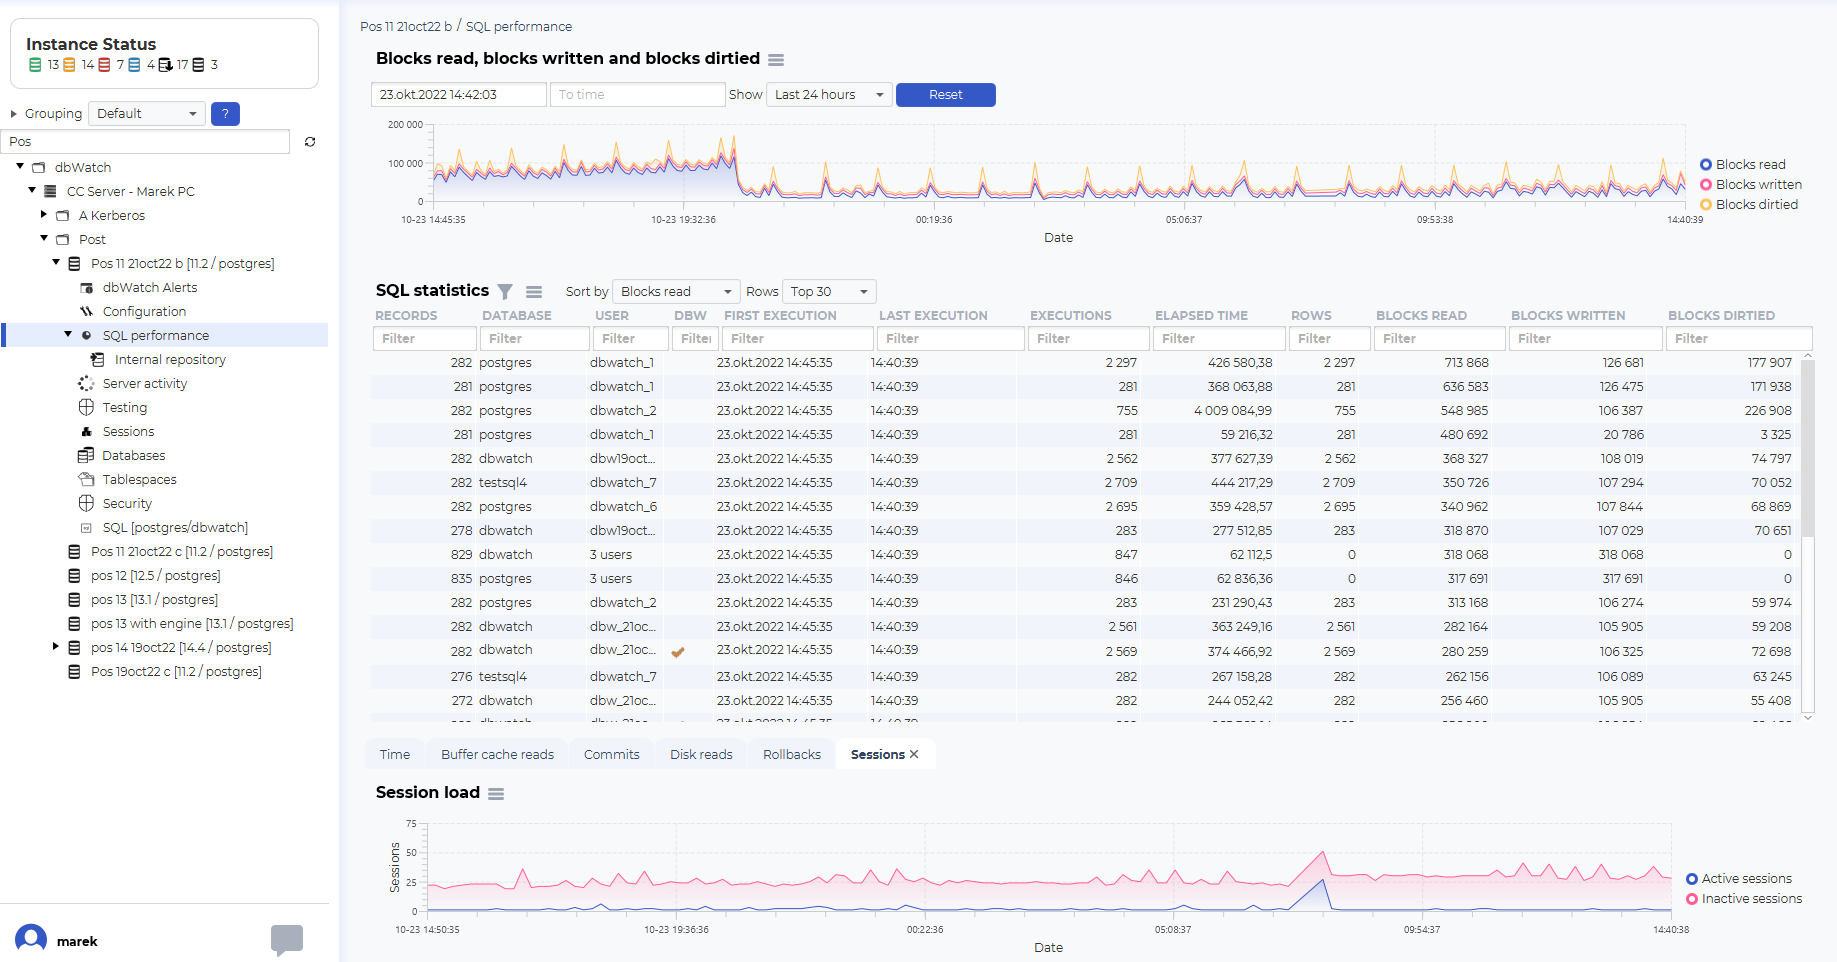
There should be a “SQL performance” node in the three structure. Click on it to open the SQL Performance dashboard.
Using the SQL Performance dashboard
Navigating time
The structure of the SQL Performance dashboard is a top graph showing historical data, such as blocks read, blocks written and blocks dirtied.
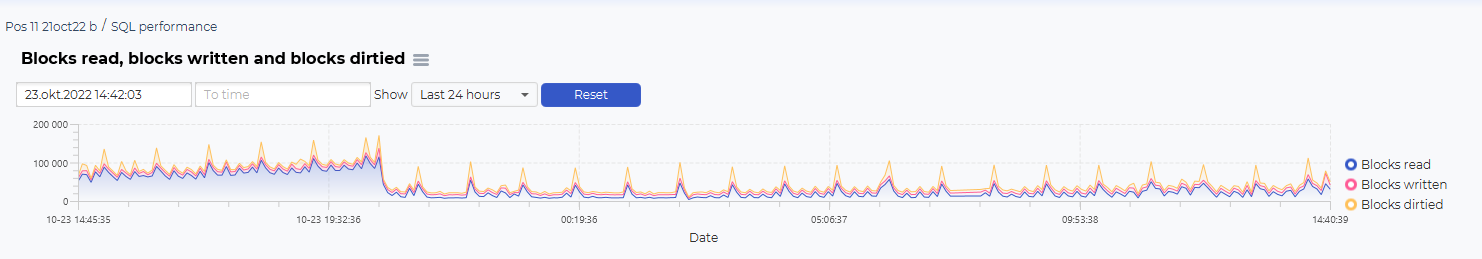
The blocks graph is used to select the timeframe you want to look at.
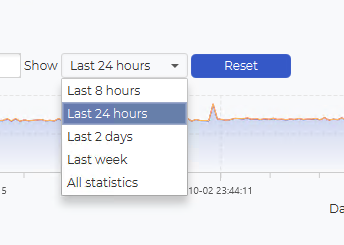
You can select predefined time selections, such as Last 8 houres, Last 24 houres, Last 2 days, Last week and all statistics:
You can also use the mouse to select a timeframe from the graph. Click on your start time, hold the mouse button, drag to the desired end time, and release the mouse button.
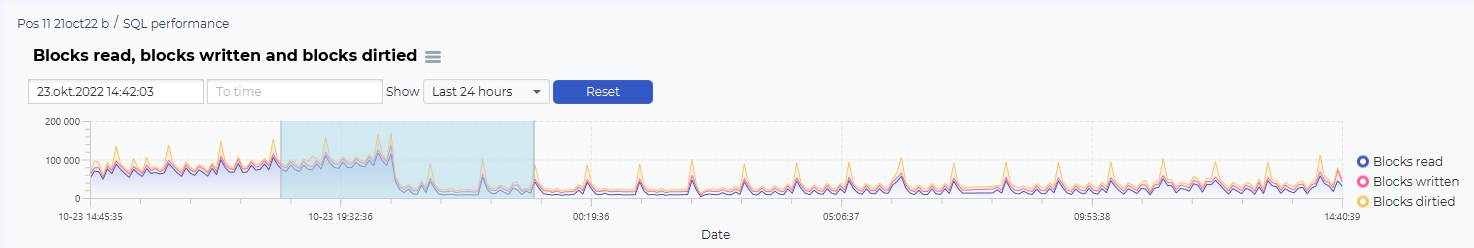
This will change the selection on the SQL statistics table and the additional information graphs.
SQL statistics
The SQL statistics will list SQL statements that has been active in the selected time period.
The fields
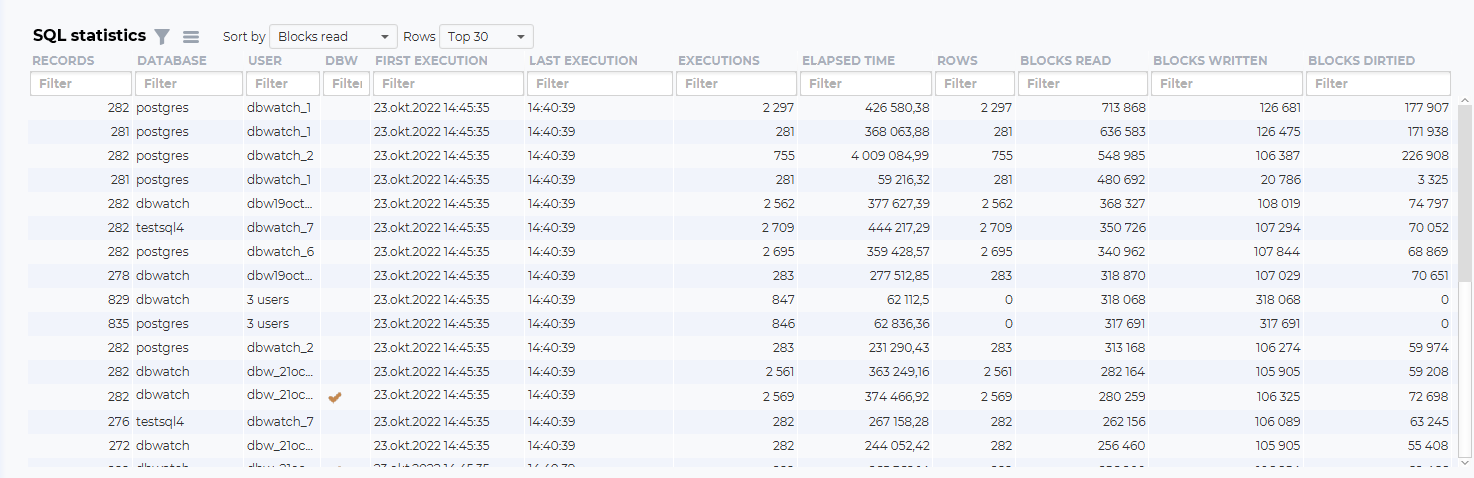
Records:
The number of times this SQL statements has been detected by dbWatch
Database:
The database executing the SQL or procedure
User:
The user executing the SQL or procedure
DBW:
Is this a SQL or procedure associated with dbWatch
First execution:
The first time in the selected time frame where this SQL or procedure was executed
Last execution:
The last time in the selected time frame where this SQL or procedure was executed
Executions:
The number of times in the selected time frame where this SQL or procedure was executed
Elapsed time:
The total elapsed time (in milliseconds) in the selected time frame where this SQL or procedure was executed
Rows:
The total number of rows in the selected time frame where this SQL or procedure was executed
Blocks read:
The total number of blocks read in the selected time frame where this SQL or procedure was executed
Blocks written:
The total number of blocks written in the selected time frame where this SQL or procedure was executed
Blocks dirtied:
The total number of blocks dirtied in the selected time frame where this SQL or procedure was executed
Navigating SQL statistics
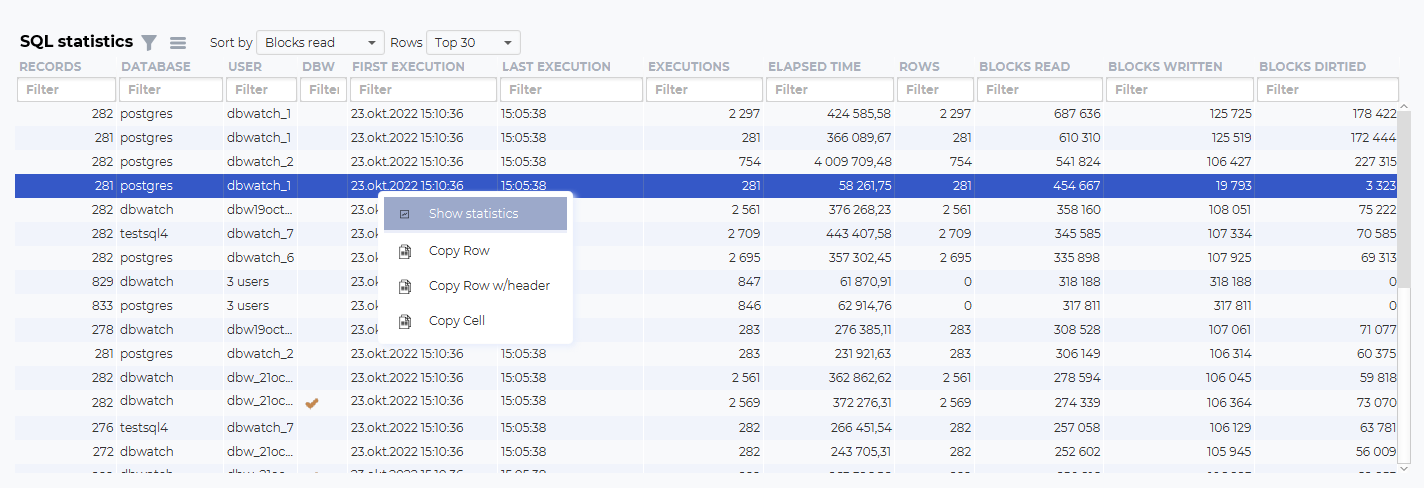
You can investigate the SQL further by right-clicking on one of the lines. Show statistics will open a new dashboard focusing on one SQL statement.
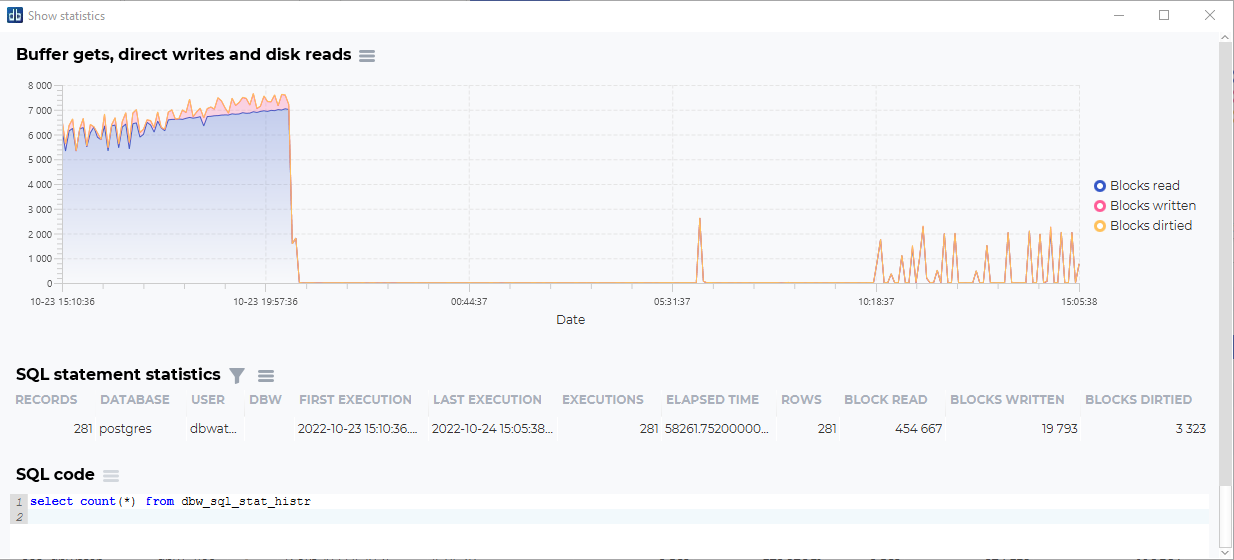
This dashboard will show blocks statistics for this statement, and the statistics for the SQL code that has been run.
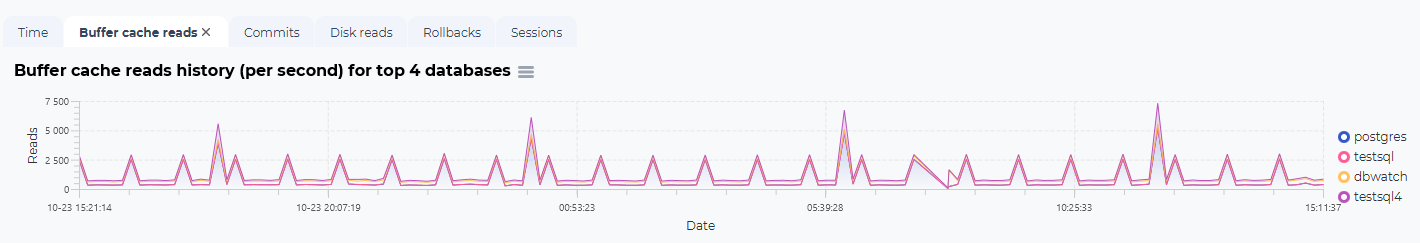
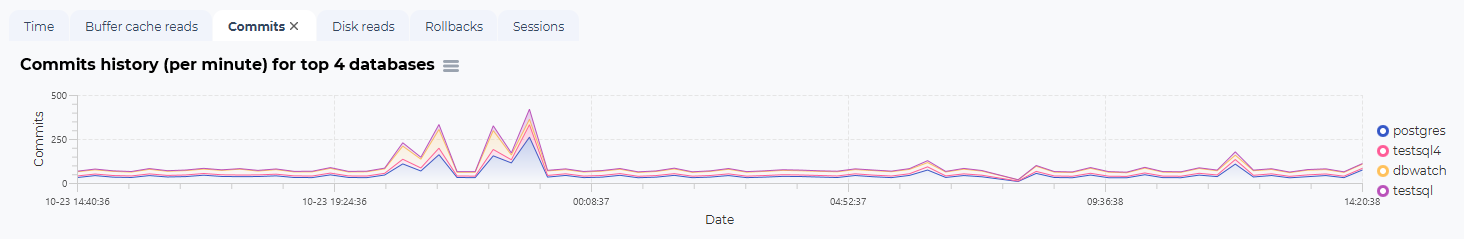
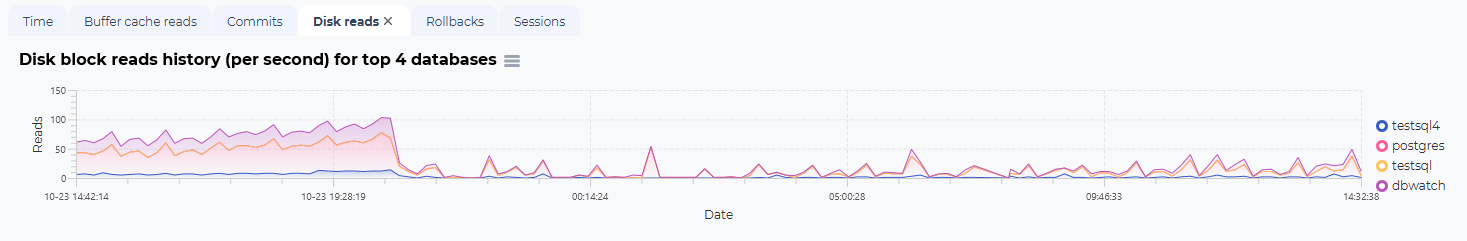
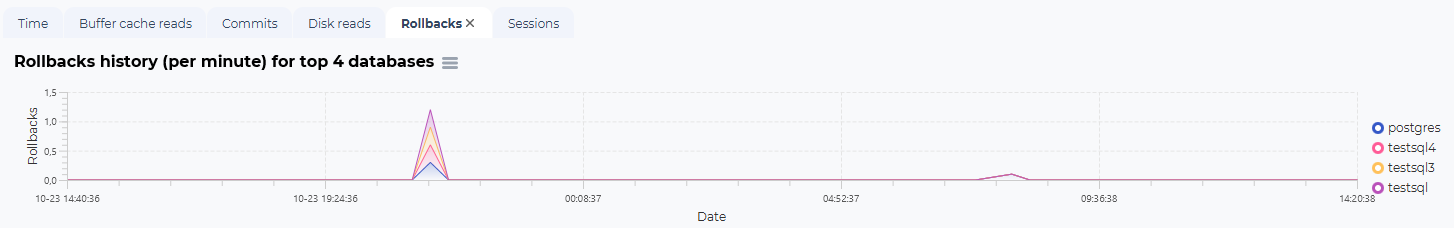
Additional graphs
In addition to the logical/physical reads and writes and the SQL statistics overview, there are additional graphs to visualize other performance statistics from the same selected timeframe.
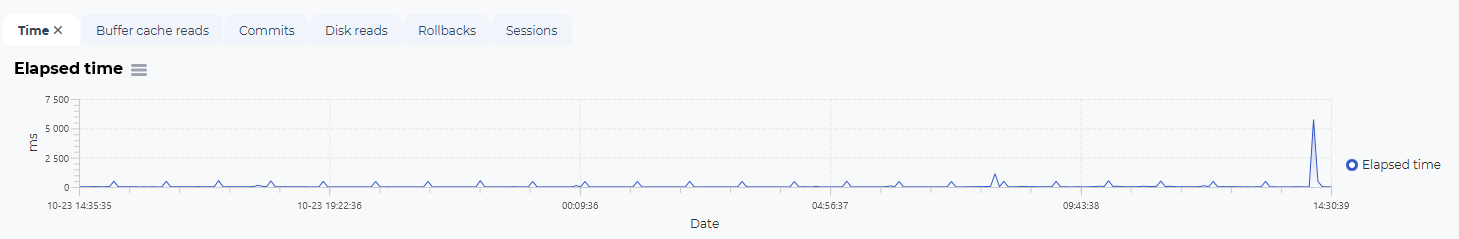
Examples:
Elapsed time:
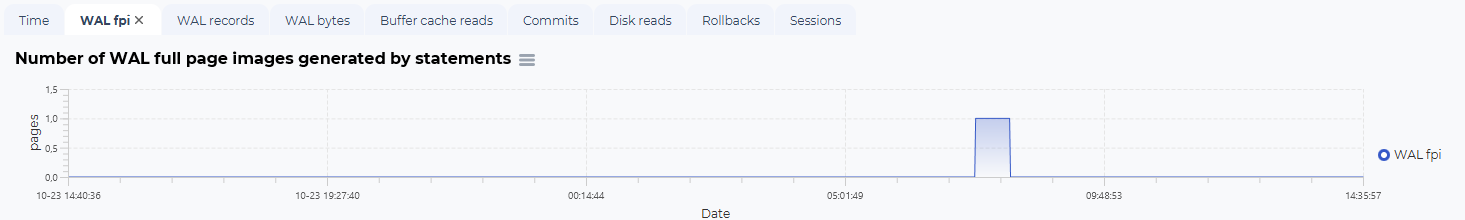
WAL fpi (only Postgres 14 and newer):
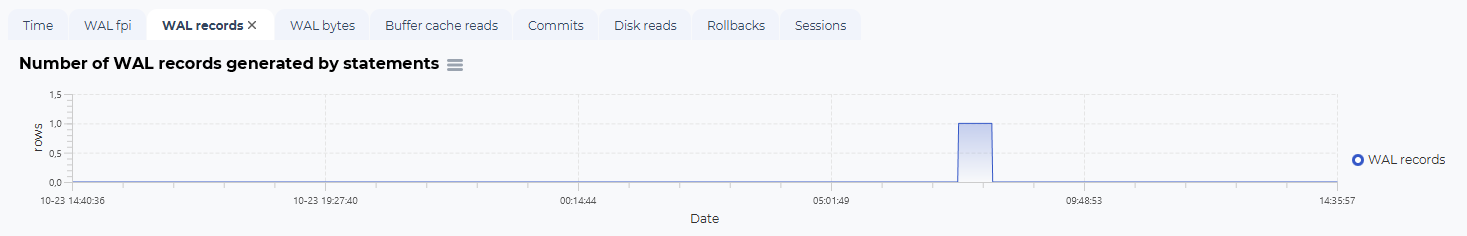
WAL records (only Postgres 14 and newer):
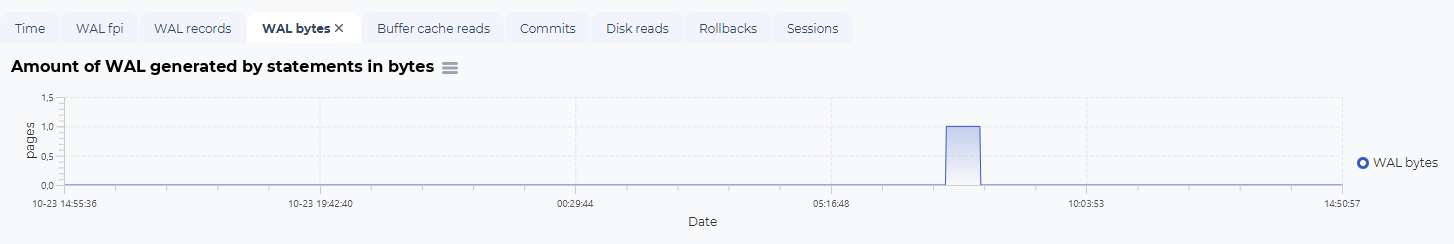
WAL bytes (only Postgres 14 and newer):
Buffer cache reads:
Commits:
Disk reads:
Rollbacks:
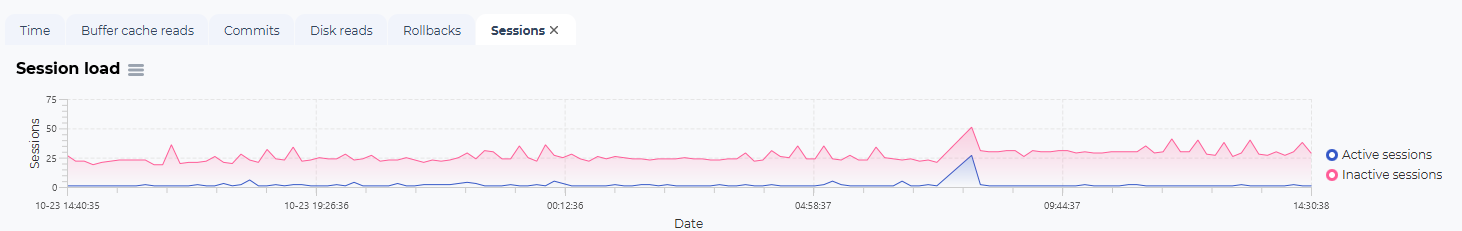
Sessions: