Navigating to the SQL Performance package dashboard
Once the SQL statistics job is installed and have collected data, you can navigate to the dashboard.
It is located in the management interface for that database instance. The pictures and descriptions are from SQL Server.

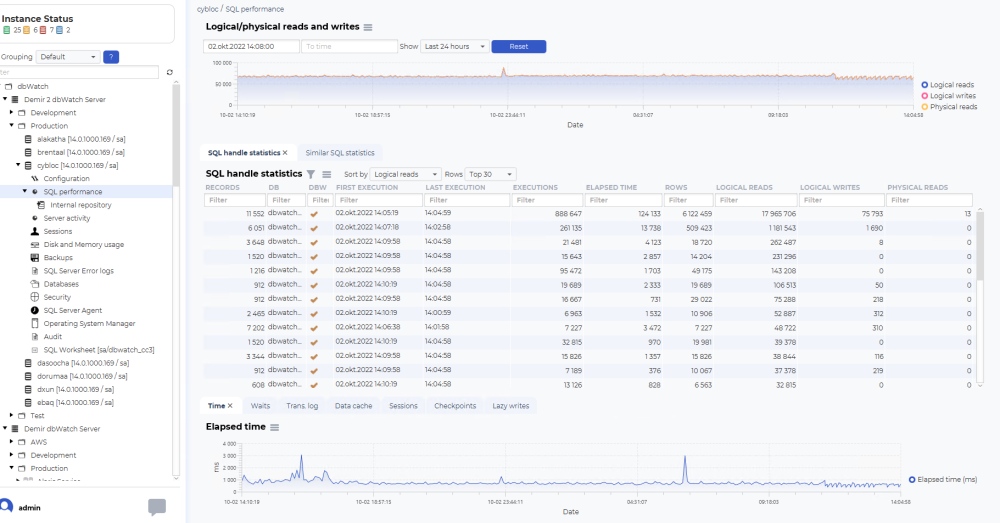
There should be a “SQL performance” node in the three structure. Click on it to open the SQL Performance dashboard.
Using the SQL Performance dashboard
Navigating time
The structure of the SQL Performance dashboard is a top graph showing historical data, such as Logical/physical reads and writes.

The logical/physical reads and writes graph is used to select the timeframe you want to look at.
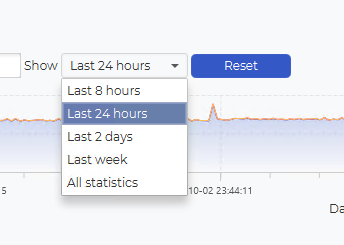
You can select predefined time selections, such as Last 8 houres, Last 24 houres, Last 2 days, Last week and all statistics:

You can also use the mouse to select a timeframe from the graph. Click on your start time, hold the mouse button, drag to the desired end time, and release the mouse button.

This will change the selection on the SQL Handle statistics table and the additional information graphs.
SQL handle statistics (SQL Server) or SQL statistics (Oracle)
The SQL handle statistics/SQL statistics will list SQL handles or SQL statements that has been active in the selected time period.
The fields

(Depending on the release of dbWatch Control Center, some fields could be missing)
Records:
The number of times this SQL statements has been detected by dbWatch
DB/Schema:
The database where this procedure is located (SQL Server) or schema executing the SQL or procedure (Oracle)
DBW:
Is this a SQL or procedure assosiated with dbWatch
First execution:
The first time in the selected time frame where this SQL or procedure was executed
Last execution:
The last time in the selected time frame where this SQL or procedure was executed
Executions:
The number of times in the selected time frame where this SQL or procedure was executed
Elapsed time:
The total elapsed time (in milliseconds) in the selected time frame where this SQL or procedure was executed
Rows:
The total number of rows in the selected time frame where this SQL or procedure was executed
Logical reads/Buffer gets:
The total number of logical reads/buffer gets in the selected time frame where this SQL or procedure was executed
Logical writes/Direct writes:
The total number of logical writes/direct writes in the selected time frame where this SQL or procedure was executed
Physical reads/Disk reads:
The total number of physical reads/disk reads in the selected time frame where this SQL or procedure was executed
M.I.
Indicates that this SQL handle is missing an index
Navigating SQL handle statistics / SQL statistics

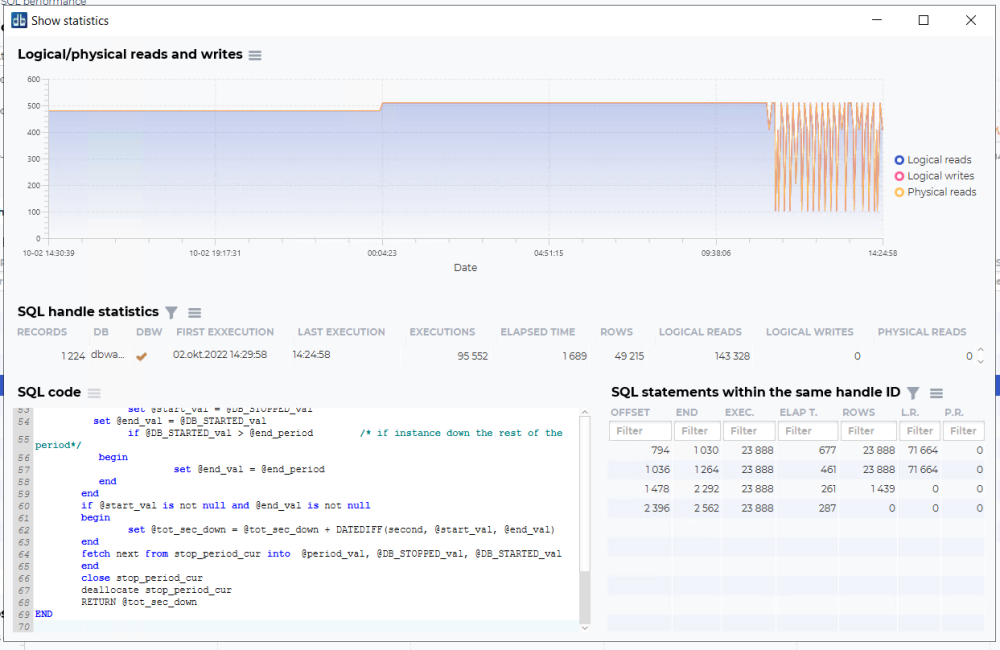
You can investigate the SQL handles further by right clicking on one of the lines. Show statistics will open a new dashboard focusing on one SQL handle or SQL statement.

This dashboard will show logical/physical reads and writes statistics for this statement, the statistics for the SQL handle, the SQL code that has been run, and also individual SQL statements within the SQL handle if it is a procedure with multiple SQL statements.

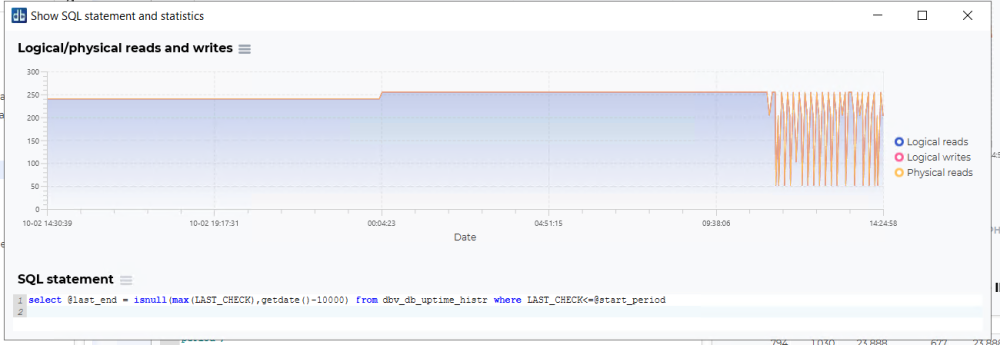
You can also open each SQL statement within the SQL handle to get statistics for that statement. “Show query plan(using SSMS)” requires setting up the integration with SSMS.

Additional graphs
In addition to the logical/physical reads and writes and the SQL handle statistics overview, there are additional graphs to visualize other performance statistics from the same selected timeframe.
Examples:
Elapsed time:

Waits history:

Transaction log – KB flushed per minute:

Data cache memory usage:

Session load:

Checkpoints:

Lazy writes:

← Installation of SQL Performance package / Integration with SSMS →


Post your comment on this topic.