Dbwatch comes with a set of benchmarks for measuring the performance capabilities of an SQLServer instance.
This benchmarks runs a series of DML statements designed to test various key properties of a database system.
This is the same benchmarks we have used to create our Azure performance report.
This topic is covered in the following video from our youtube channel
How to measure performance on SQLServer.
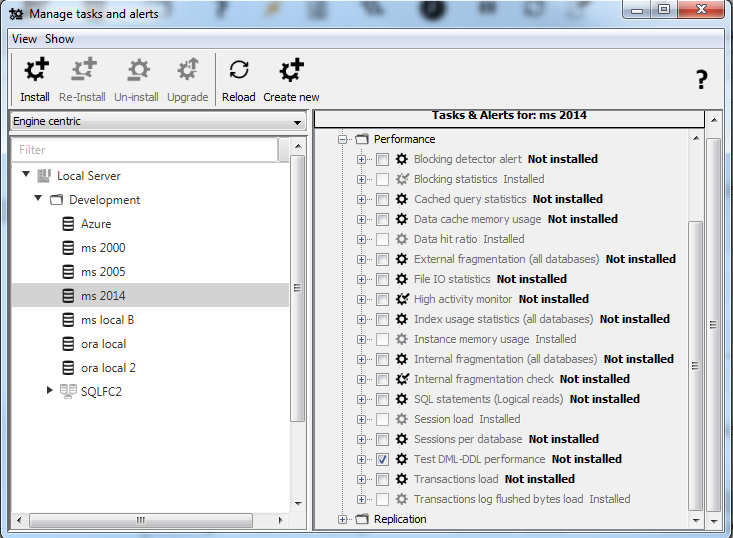
To execute the performance test on MS SQL Server instance, the “Test DML-DDL performance” tasks must be installed.


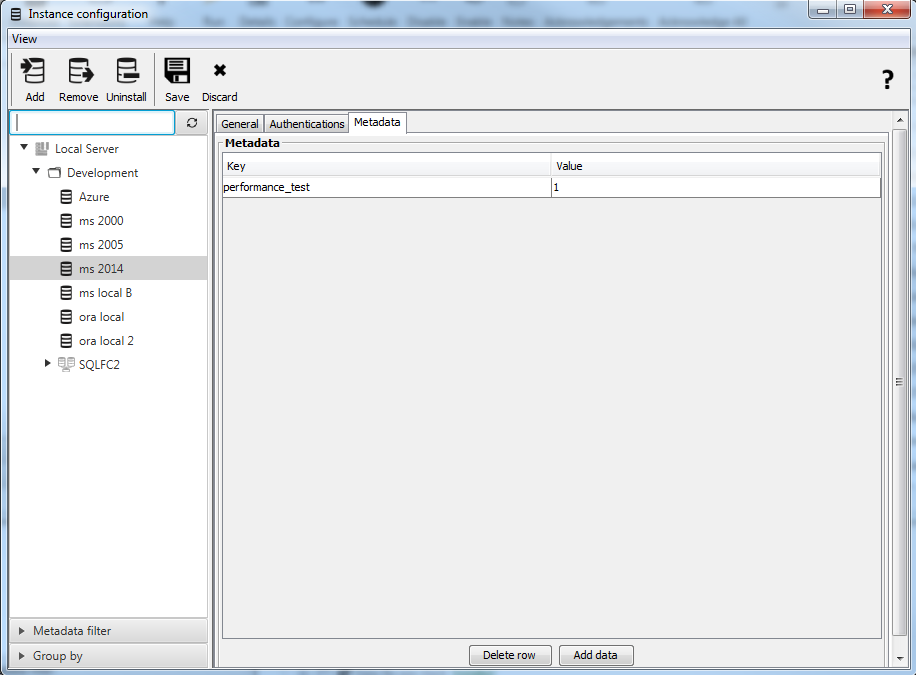
Then a meta data “performance_test” must be added to the instanase with value “1”. Rightclick on the instance and chose “Configure”. Select the “Tetadata” tab, and add metadata.

After adding the “performance_test” meta data, you can switch to “Management” tab in the dbWatch Monitor GUI. Select the instance, then “Performance”, and then “Performance test”
You are now ready to perform a test.

To execute the entire test sequence select “Run all tests: 5000 – 160000 records”

Your will get a confirmation box which inform that 6 test will be executed sequentially with one minute pause between each test.

After around 6 minutes you will get performance statistics.

The time interval for two upper graphs is 15 minutes and values are plotted every 15 seconds. In this test sequence, there are 6 test runs on 5K, 10K, 20K, 40K, 80K and 160K rows. The graphs show “Log KB Flushed” per second, and “Logical reads” per second.
The middle graphs shows average speed per 1000 rows per DML statement. (“INSERT”, “SELECT”, “UPDATE” and “DELETE”), and the total time per test run per DML statement.
The bottom part shows the database information that is being tested, such as databasename, version, edition, test date etc. The last table shows statistics from the test.
You can also show at the statistics by selecting the “Show statistics” meny.

The bottom table show the average values per 1000 rows per DML statement, and the last column shows the total elapsed time in milliseconds.

The “Total elapsed time (ms)” values (in our example 69.9 ms) shows you how fast your machine are. In article “Azure database performance” in section “Comparative test of MS SQL Servers on physical and virtual environments” you can read/compare your statistics with other machines.


Post your comment on this topic.