Required file
You need one file dbWatchMP.xml that can be downloaded from the following location:
https://github.com/dbWatch/scripts_and_tools/tree/master/Extensions/SCOM
Installing
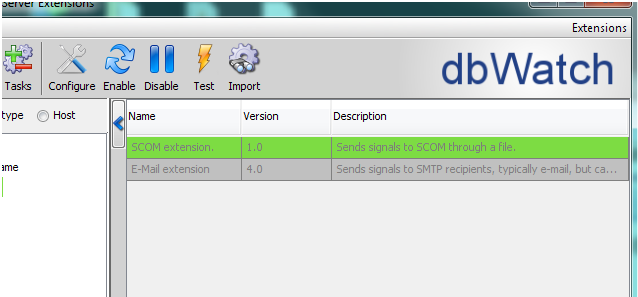
The first thing you must do is to tell dbWatch to export the SCOM text file. In order to do this, (in the dbWatch Monitor) click on the «Configure-> Extensions» menu.
Here you should now see an entry called «SCOM extension». Select it and click «Configure». In the configuration view you can specify the filename for the generated text file, as well as how long dbWatch should wait before generating the file for the first time («firstrelay») and how often the file should be updated («relayperiod»).
When you are satisfied with the settings, click «OK». Then select the SCOM extension again, and click «Enable». The entry should then turn white.
dbWatch will now (with the default configuration) generate the «scom.txt» file after 70 seconds, and update the file once every 40 seconds. Please verify that this file is generated before moving onto the next step.
Importing the dbWatch MP
Before you can import the dbWatch Management Pack into the System Center Operations Manager, you must first do a small manual change in the dbWatchMP.xml file.
Open it in a text editor (for example WordPad), and replace all occurrences of “[DBW-SCOM-PATH]” with the path to the scom.txt file you defined in the last chapter (Probably something like: “C:\Program Files\dbWatch\10.0\scom.txt”).
Once this is done you are ready to import the Management Pack.
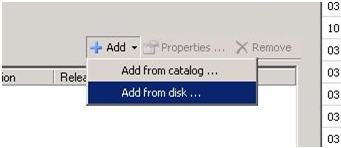
Right click on the “Management Pack” node in the Administration tab of the SCOM Console, and select “Import Management Packs”.
Then select “Add from disk” in the Import dialog.
Select “No” if it asks you to search the online catalog for dependencies.
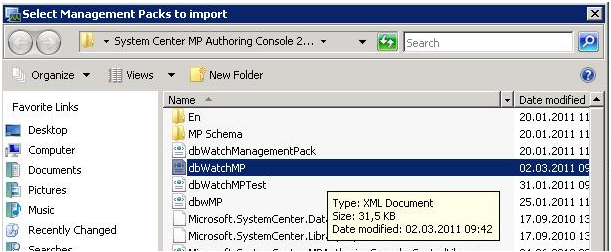
Then locate the dbWatchMP.xml file you edited earlier, select it and click “Open”.
Then click “Install” in the next dialog.
Using the extension
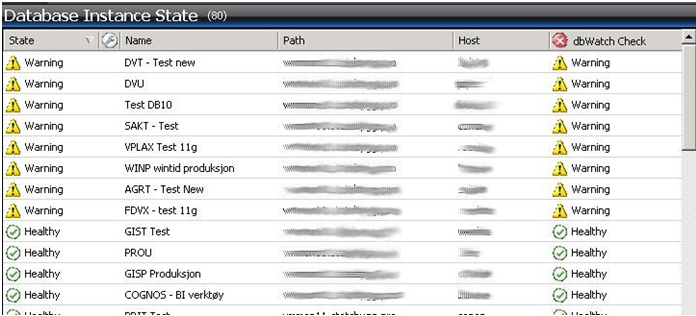
In the Monitoring tab of the SCOM Console you should now see a folder called “dbWatch” with two state views. “dbWatch State” will tell you what machines SCOM has discovered dbWatch on, and the health of the application. “Database Instance State” will show you a list of all the monitored instances and their health.
If you click on “Database Instance State” you will see a list resembling the following (it will take some minutes before this table will be filled) .
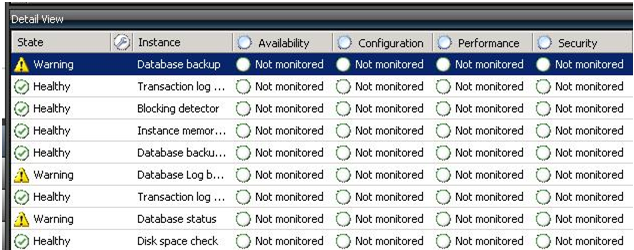
If you click in a row in the “dbWatch Checks” column, you will see a table with all the Checks that are installed on this instance (again it will take a while before this is filled the first time).
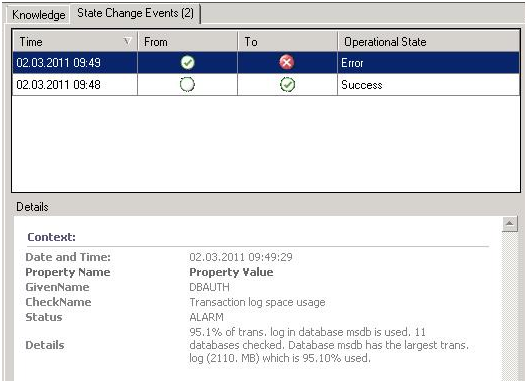
If you double click on a check, you will see the details of the check.







Post your comment on this topic.