Using Control Center
This section introduces the main user interface of dbWatch Control Center and describes the key modules and components you will use on a day-to-day basis.
Upon launching dbWatch Control Center, you will start in the Monitoring View by default.

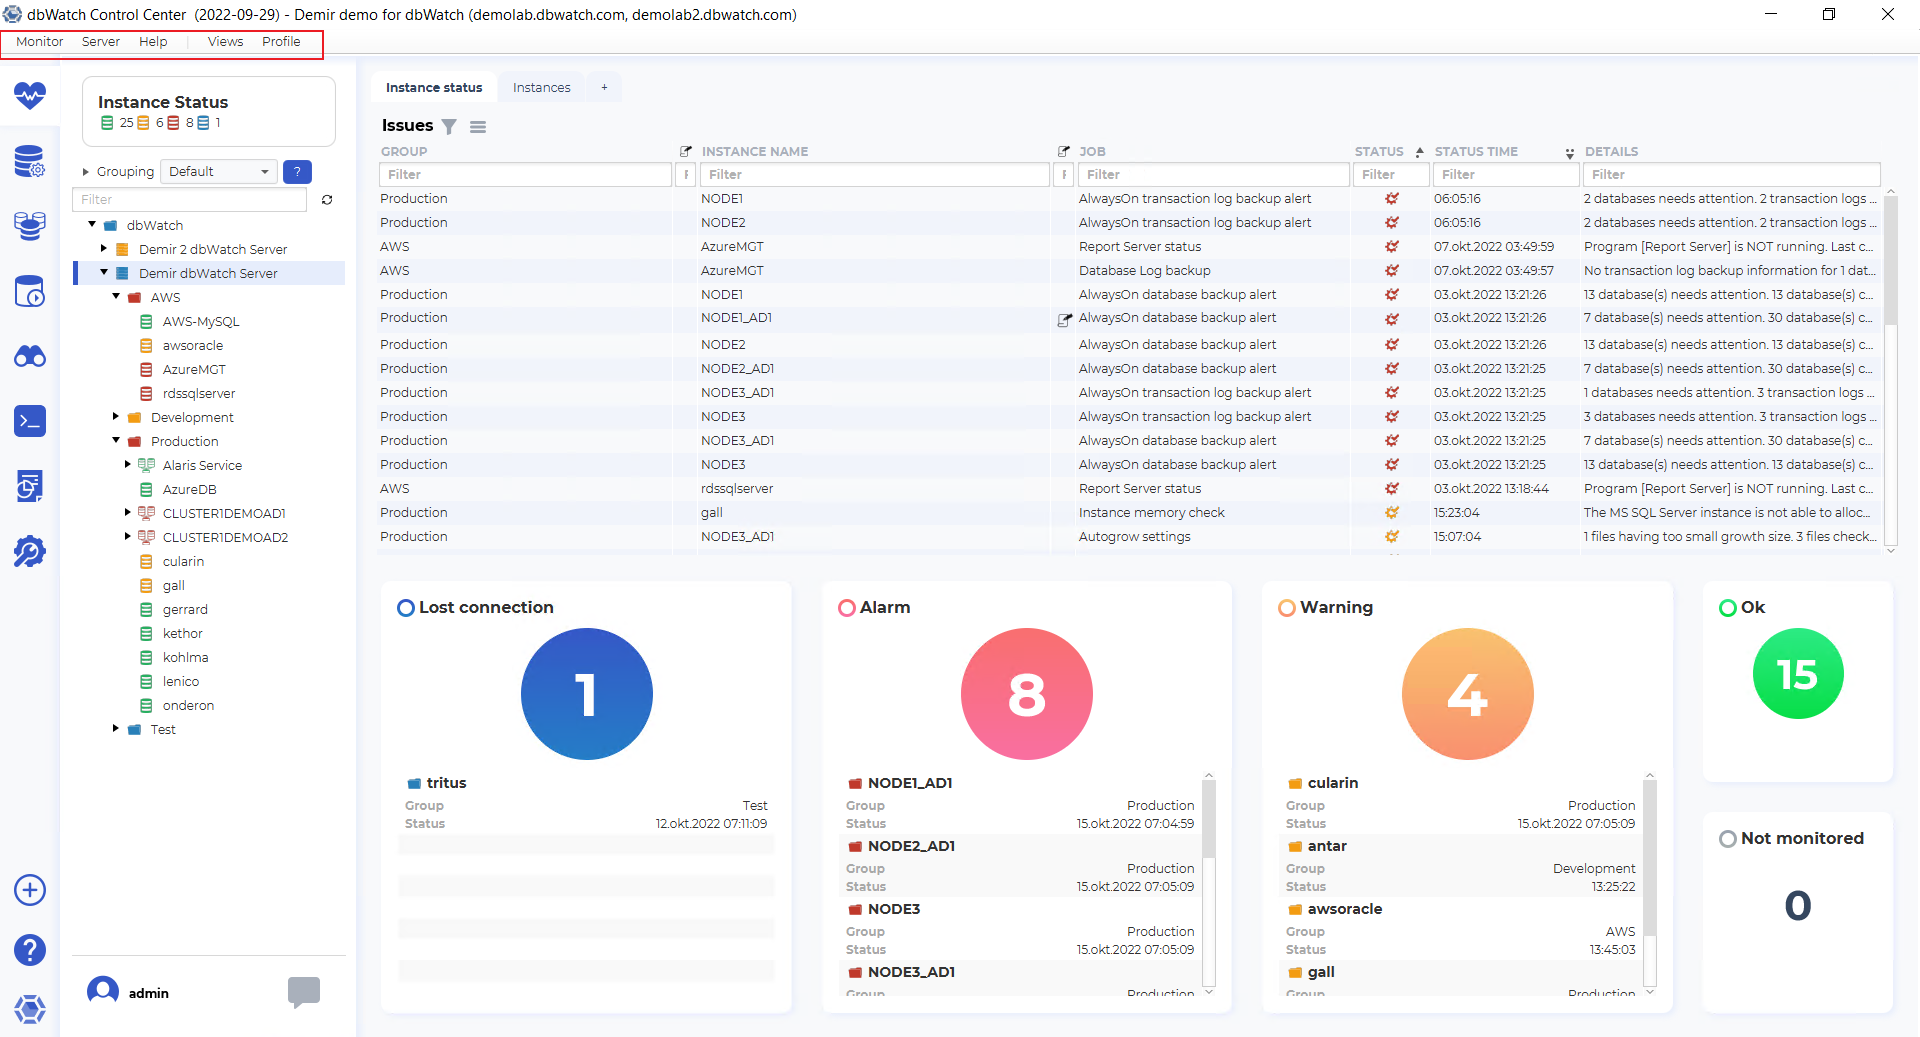
At the top of the interface is the Top Menu, which provides access to:
- Client configuration settings
- Server connection setup
- Additional preferences and global options
For more details, see:
You can also enable or disable specific UI modules based on your needs:
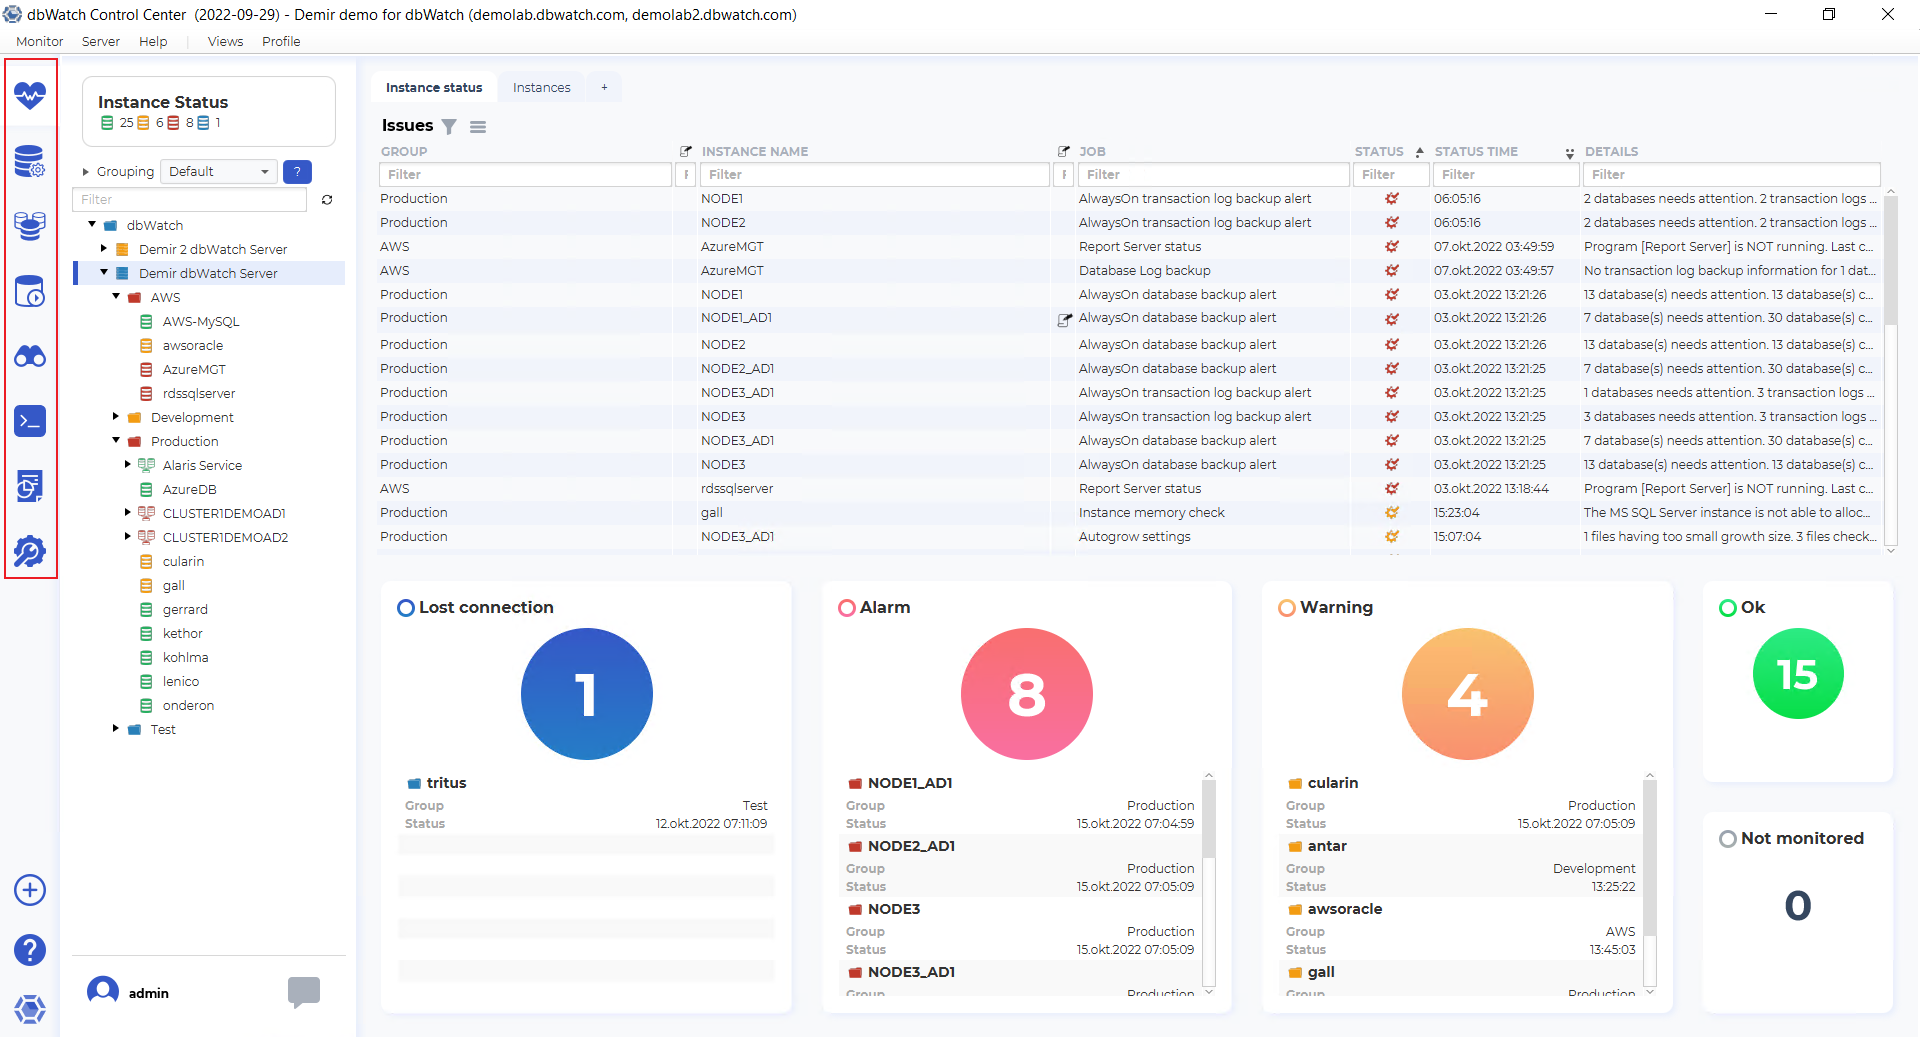
On the left-hand side of the interface, you’ll find the Module Navigation Panel, which lists the core modules of dbWatch Control Center.
Explore the modules in detail here:

Beneath the module list is the Action Bar, which includes:
- The “+” icon to add new database instances
- A “?” icon to open this documentation wiki
- The dbWatch icon to access the “About” view, including version information
For more on managing instances, see:

To the left of the module panel is the Instance Status Indicator. This shows a color-coded summary of instance health:
- Green – OK
- Yellow – Warning
- Red – Alarm
- Blue – Connection lost
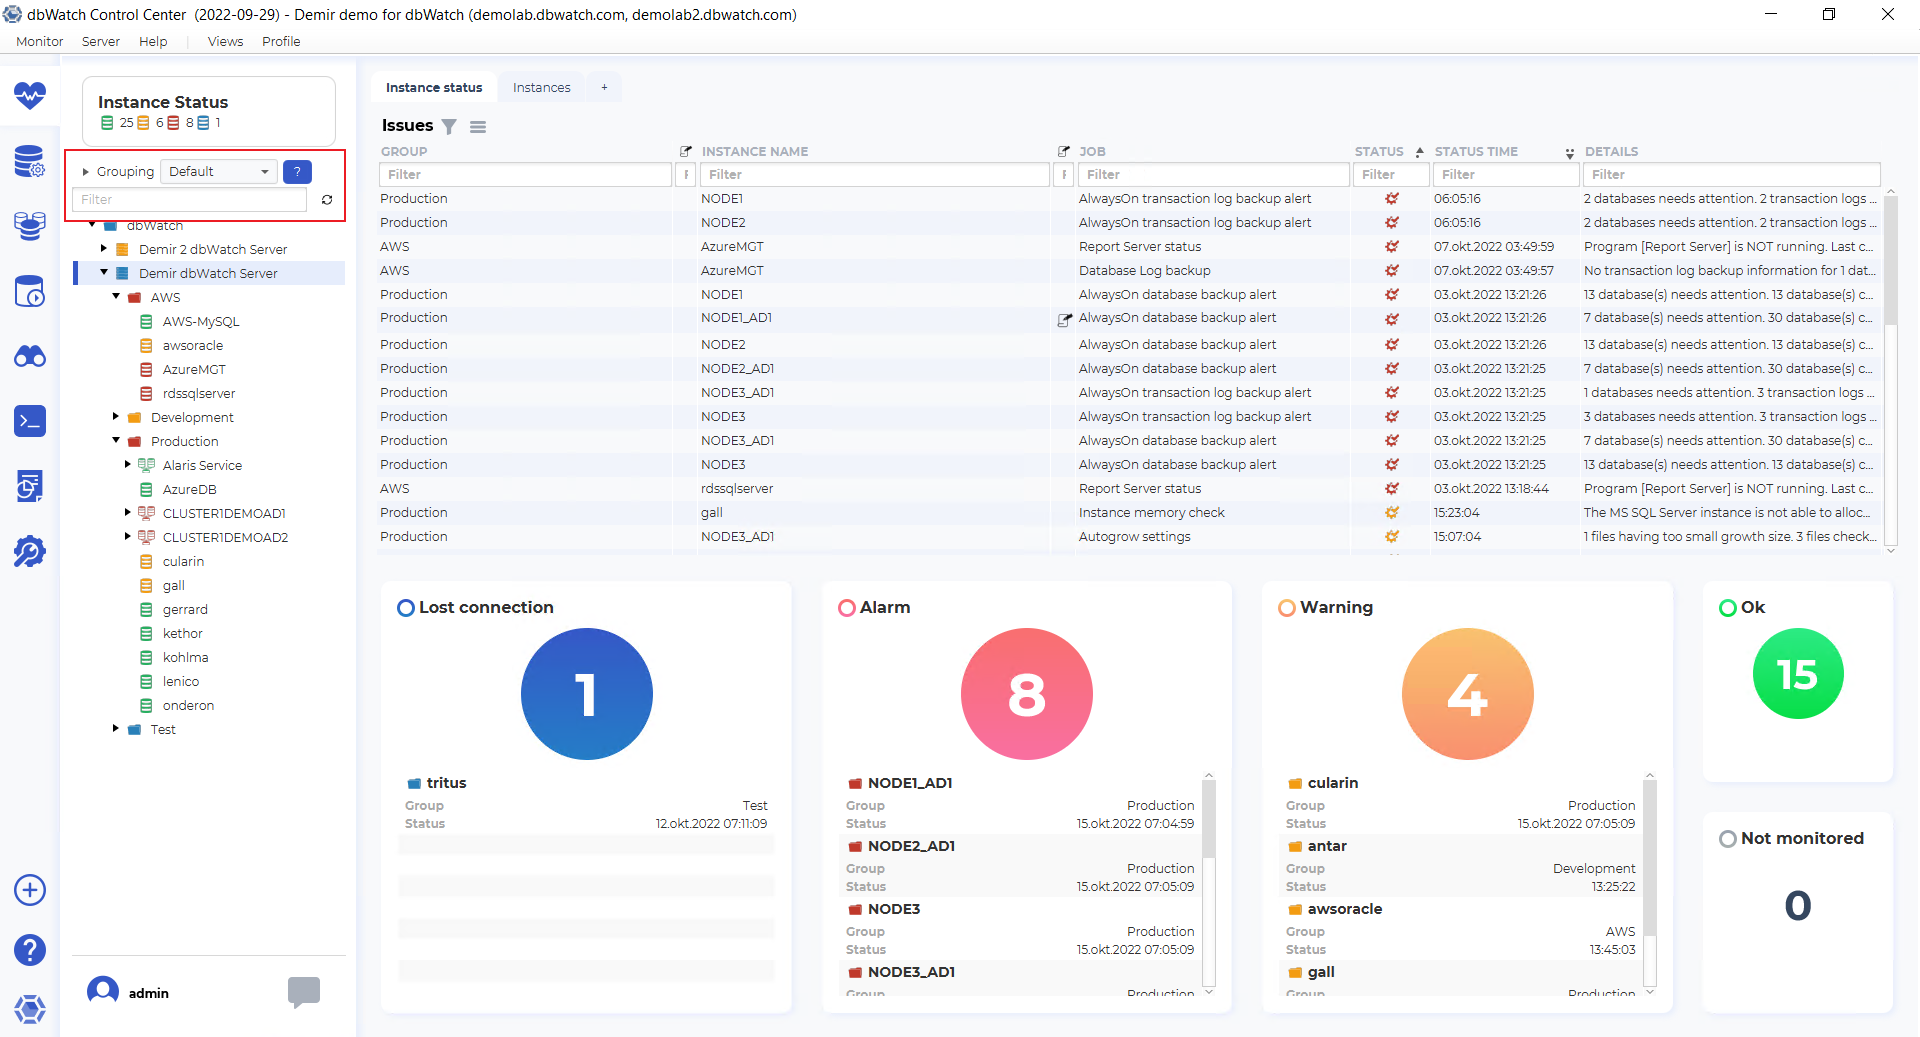
Below the status indicators, you’ll find the Grouping and Filtering Panel. This allows you to group instances logically (e.g., by environment or region) and apply filters for easier navigation.
Learn more:

The Instance Tree View appears beneath the filters. Use this area to select and explore specific instances. Clicking an instance opens its corresponding job overview in the main panel.

At the bottom of the left-hand panel:
- The logged-in username is displayed.
- A chat icon appears to the right—this shows new messages and allows you to chat with other DBAs currently connected to Control Center.
For a detailed walkthrough of the Monitoring module itself, see: