Restore configuration backup
The configuration files in dbWatch are continously backed up using git.
Reverting to an old backup
Step one
If you don’t have git tools installed, you can download them here
Step two
After stopping the dbWatch Server, use a command prompt (that understands git commands) and, navigate to the config catalog.
By default this is “C:/ProgramData/dbWatch/[version]/server/config” on Windows.
Be sure to do this as an Administrator (or some other user that has write privileges on this catalog)
Step three
Take a backup of the entire config catalog (it’s never a mistake to have a backup)
Then type the following git command to see the git entries.
git log --pretty=format:"%h %cD %s"You should see something like the following

Step four
Find the entry you want to revert to. This can involve a bit of guessing, but based on the time column and the descriptions, you should be able to find a line that corresponds to the version you want to revert to. If you are unable to figure out what entry you want, there are also graphical tools (like git gui) that can visualize the differences between the versions better.
Step five
The start of the line you want to revert to is a series of numbers and letters called a hash
Type the command “git checkout [hash] ./server_configuration.xml”, f.ex:
git checkout c67ebaf ./server_configuration.xmlStep six
Commit the new version to git by typing “git commit -m”[message]”, f.ex:
git commit -m"got backup"Step seven
Restart the dbWatch Server
Troubleshooting
If you get an error message like the following:
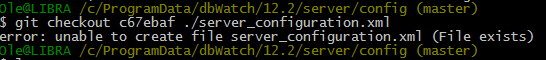 Then the most likely cause is that your user does not have write privileges on the catalog.