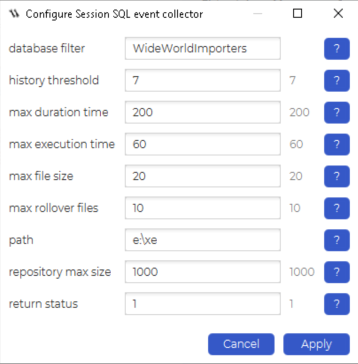
Configuration & parameter descriptions
| Parameter | Default | Sqltype | Description |
|---|---|---|---|
| database filter | (blank) | 0 (text) | List of databases the collector should apply to. Comma-separated values accepted. Wildcards (%) supported, e.g. %Sales% includes all databases with “Sales” in the name. |
| history threshold | 7 | 6 (long) | Days to keep rows before they’re removed from the history table. |
| max duration time | 200 | 5 (integer) | Threshold (in microseconds) for capturing SQL batches and RPC calls. Only queries with duration >= this value are logged. |
| path | (blank) | 0 (text) | Full folder path where event data will be stored. The file name is dbWatchSessionStatsXE. All captured events are written here for later analysis. |
| max file size | 20 | 5 (integer) | Maximum size in MB for a single event file before rollover (must be >= 11 MB). |
| max rollover files | 10 | 5 (integer) | Maximum number of event files to retain. When reached, the oldest file is deleted. |
| return status | 1 | 5 (integer) | Status returned when either “repository max size” is reached or “max execution time” is exceeded: OK = 0, WARNING = 1, ALARM = 2. Useful for alerting/monitoring. |
| repository max size | 1000 | 5 (integer) | Maximum size (in MB) of the repository history table before a warning/alarm is triggered. |
| max execution time | 60 | 5 (integer) | Maximum allowed job runtime (in seconds). If exceeded, a warning/alarm is triggered. |
Example configuration
Quick checklist
Create the folder specified in path and grant write permissions to the SQL Server service account.
Verify event files roll over based on max file size and max rollover files.
Monitor repository growth
; raise max duration time (duration threshold) or reduce retention if growth is too high.
Example — correlate an event (Session 74) with SQL Performance
Scenario
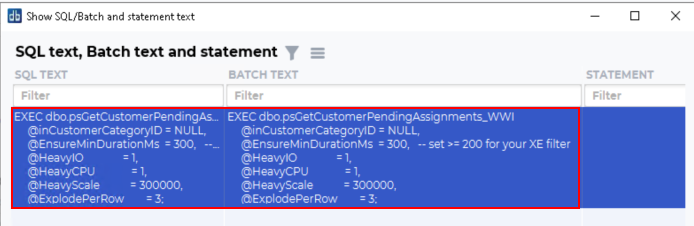
We see that Session 74 executed the stored procedure:
EXEC dbo.psGetCustomerPendingAssignments_WWIIn the Session SQL Event Collector we have SQL text, batch text, and standard attributes (session id, database, application, host, login, timestamps, etc.). We’ll use the procedure name to inspect its performance in the SQL Performance module.
Steps
Identify the hit in the Event Collector
Open the Session SQL Event Collector view and locate the event for SessionId = 74 showing:
EXEC dbo.psGetCustomerPendingAssignments_WWI
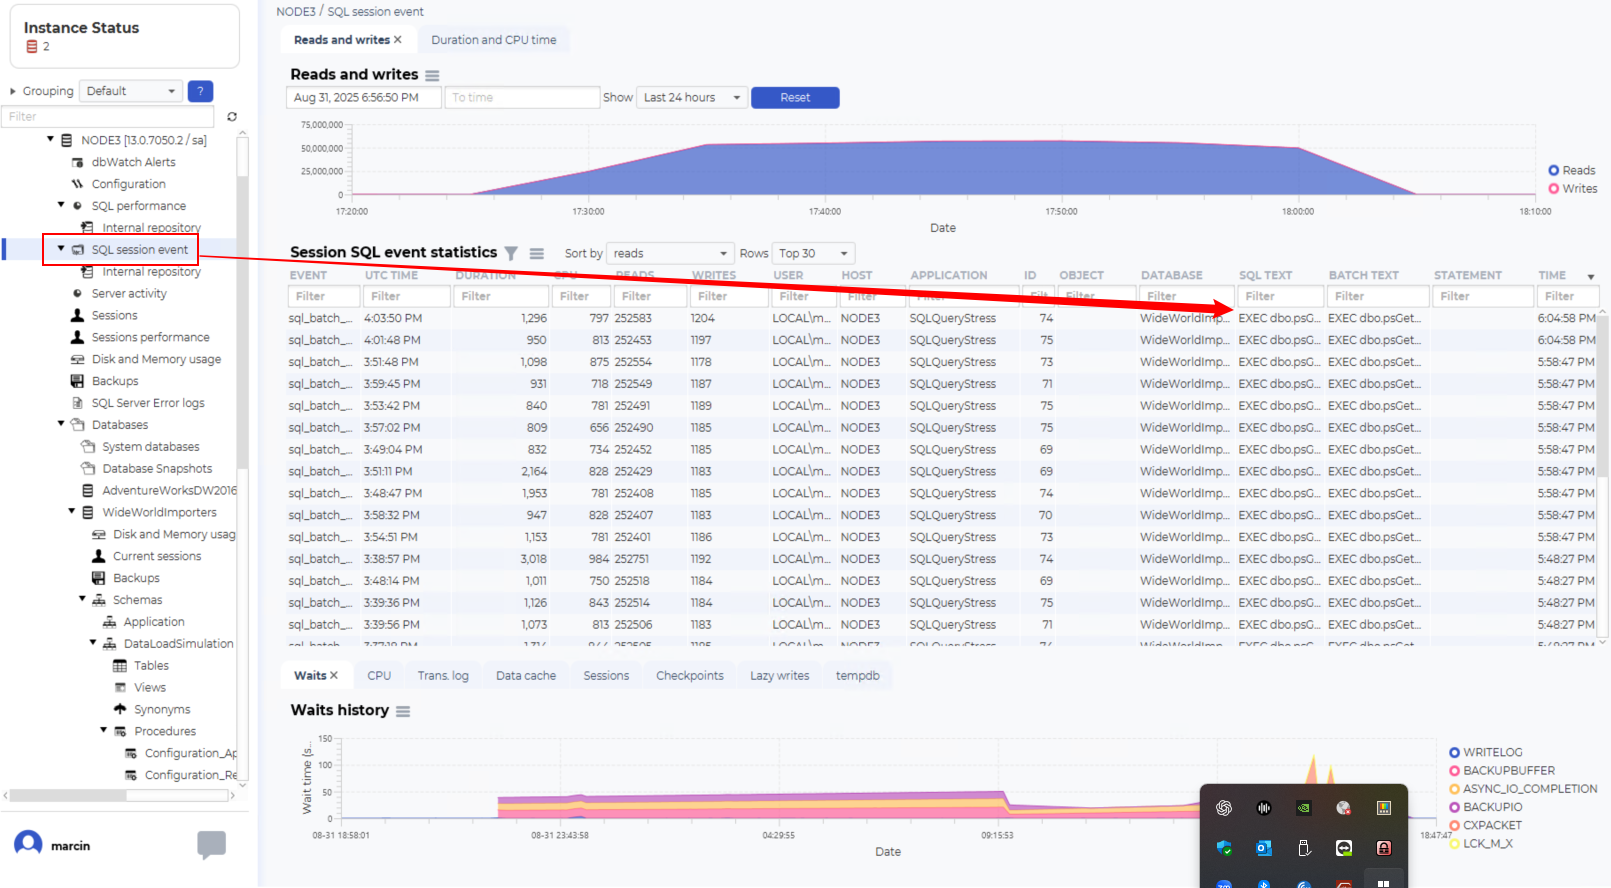
Note the timestamp and relevant context (database, application, host, login).
Open SQL Performance and search for the procedure
Go to SQL Performance.
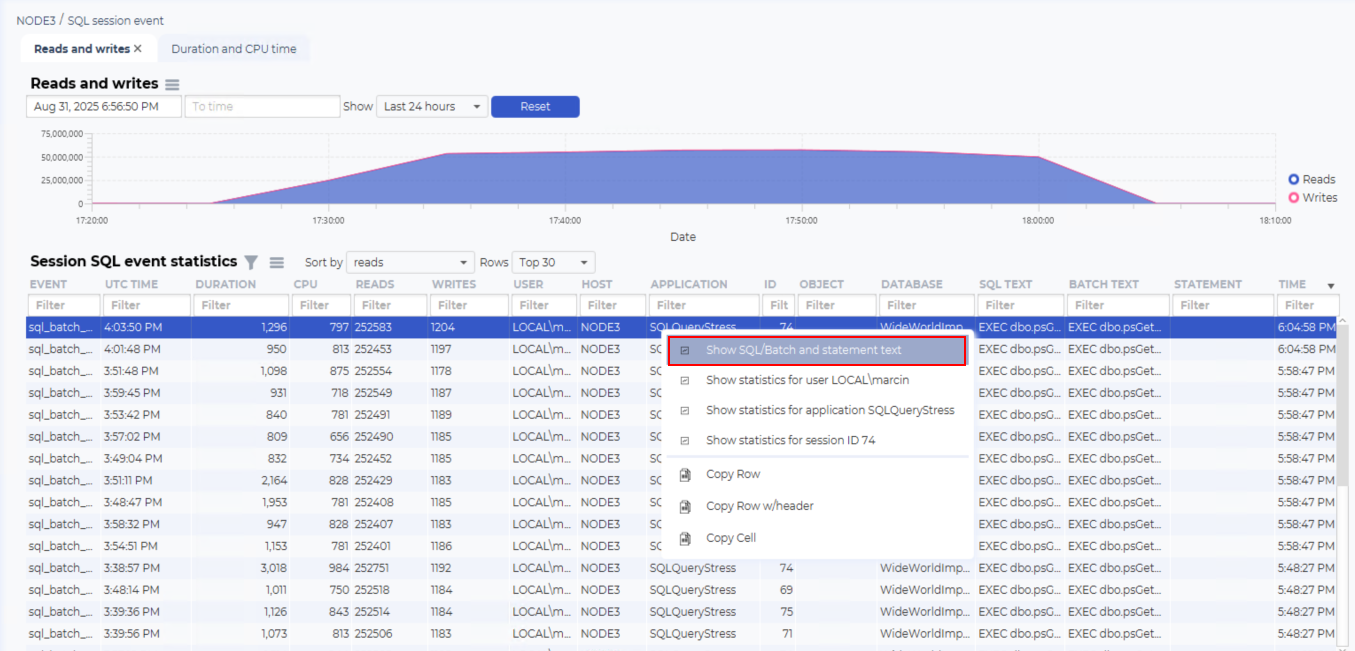
Right-click any row and choose Find text….
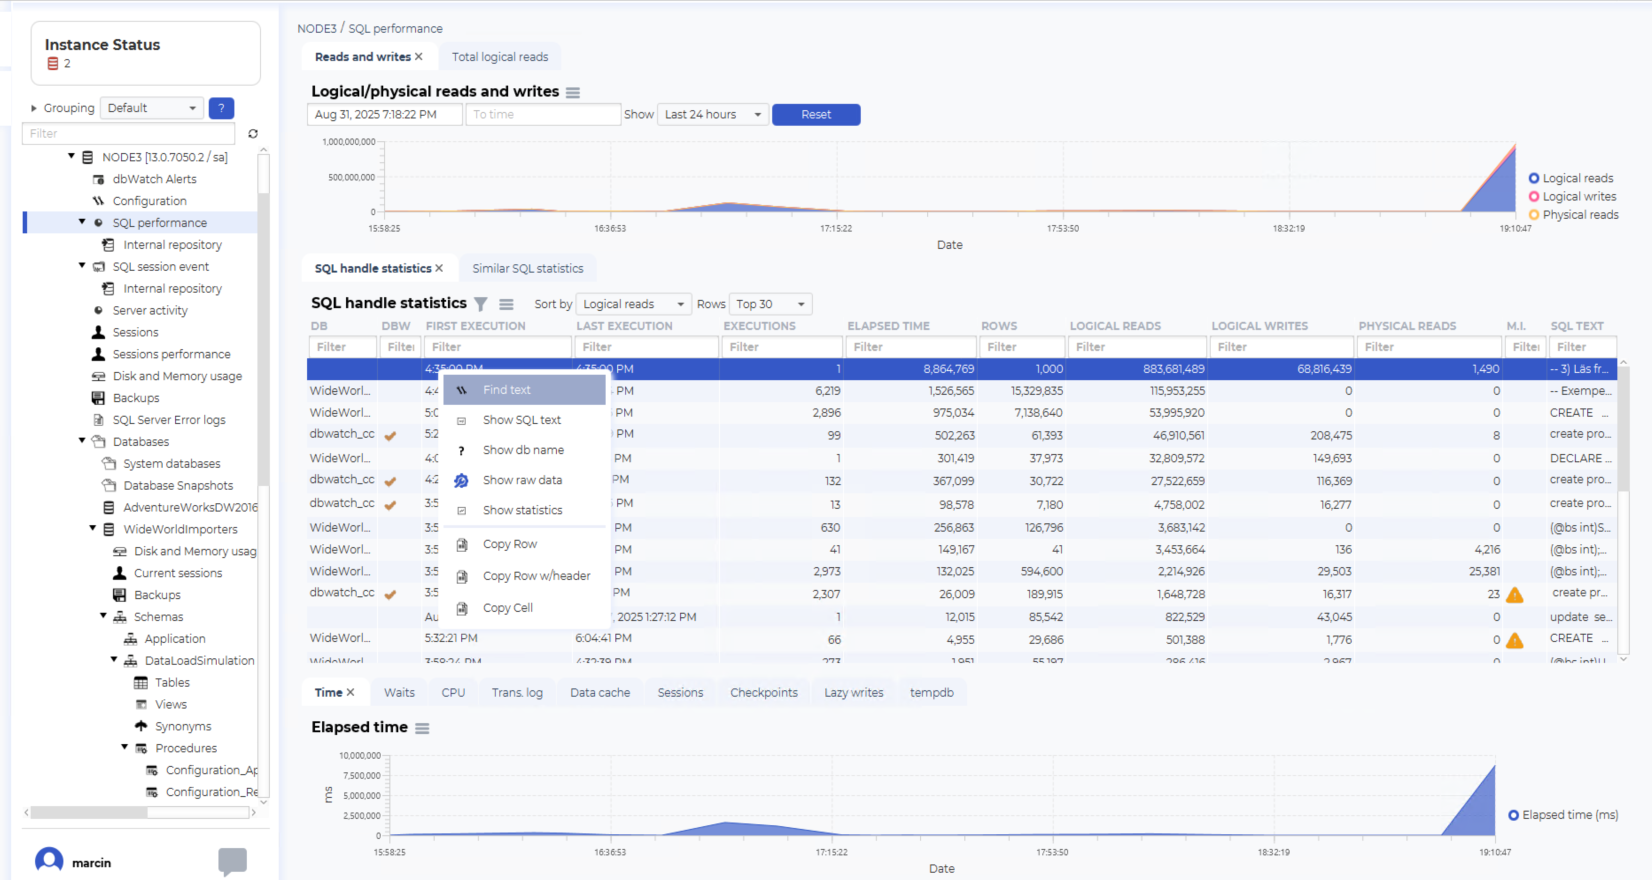
Enter the stored procedure name: psGetCustomerPendingAssignments_WWI
Tip: If you get no results, try without the schema or use a wildcard, e.g. %psGetCustomerPendingAssignments%.
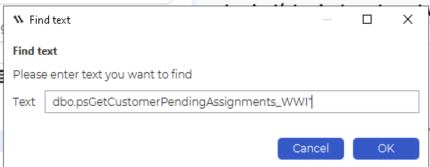
Click OK.
Review the results
You should see collected records where this procedure appeared.
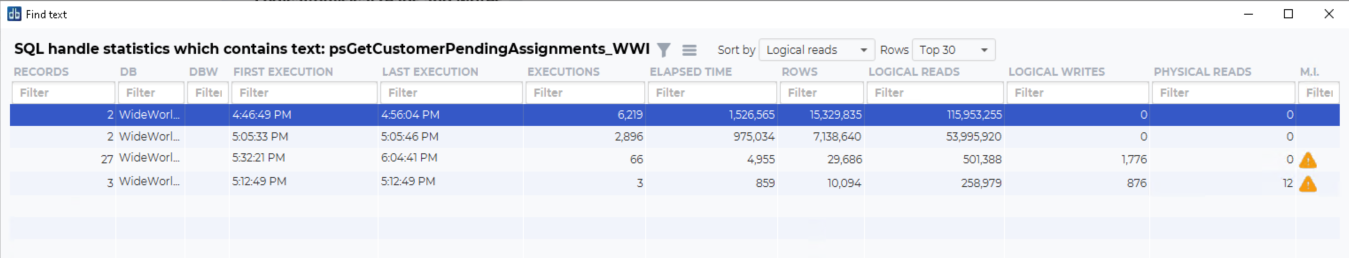
Align the time window with the timestamp from Step 1 so you’re reviewing the same period.
Look at key metrics: executions, average/max duration, CPU time, reads/writes, last execution time.
Drill down and correlate
Sort by duration or CPU to find the worst intervals.
Compare peak times with the Event Collector entry for Session 74.
Use context (database, application, host, login) to confirm it’s the same workload and identify the calling app or user.
Expected outcome
You can see when and how dbo.psGetCustomerPendingAssignments_WWI was used, quantify its cost (duration/CPU/IO), and tie specific slow executions back to the Session 74 event.
If nothing shows up
Widen the time range in SQL Performance to include the Event Collector timestamp.
Try the search without schema or with wildcards.
Confirm the SQL statistics job is running and history hasn’t been trimmed beyond your retention settings.
Review Repository management & monitoring for retention and cleanup details.
See also
Adding EVENT SESSION functionality