Using EVENT SESSION functionality (available from Q4 2025)
This module is an advanced performance monitoring extension for Microsoft SQL Server. It leverages native Extended Events (XEvent) functionality to capture detailed execution statistics. While the module can run independently, it is primarily designed to complement the SQL Performance module in dbWatch for deeper workload insights.
How It Works
The Session SQL Event Collector installs a dedicated job that collects execution statistics directly from the dbWatchSessionStatsXE Extended Events session. This approach provides highly granular visibility by capturing:
* Long-running SQL batches and RPC calls
* Session details (client, host, user)
* Database-specific context and query execution information
When combined with the existing SQL Statistics job (which captures cached plan metrics from system views such as sys.dm_exec_query_stats, sys.dm_exec_sql_text, and sys.dm_exec_text_query_plan), dbWatch provides a two-layered performance analysis:
* System-level visibility: An overview of cached query plans and system performance patterns.
* User-level visibility: Detailed insight into who is running what and where.
This dual approach equips DBAs with a complete picture of performance bottlenecks and workload trends.
Performance Considerations
Because Extended Events sessions can generate large volumes of data, careful planning is critical:
* Limit monitoring to one or two databases at a time.
Running the Session SQL Event Collector across many databases simultaneously may put unnecessary load on the instance and negatively impact performance.
* Monitor dbWatch’s internal repository and instance file storage.
Event session data is stored in these locations, and rapid data growth may occur under heavy workloads. Regular checks help prevent disk space issues and ensure smooth operations.
By enforcing these boundaries, DBAs can maximize diagnostic value without introducing overhead.
Navigation in dbWatch
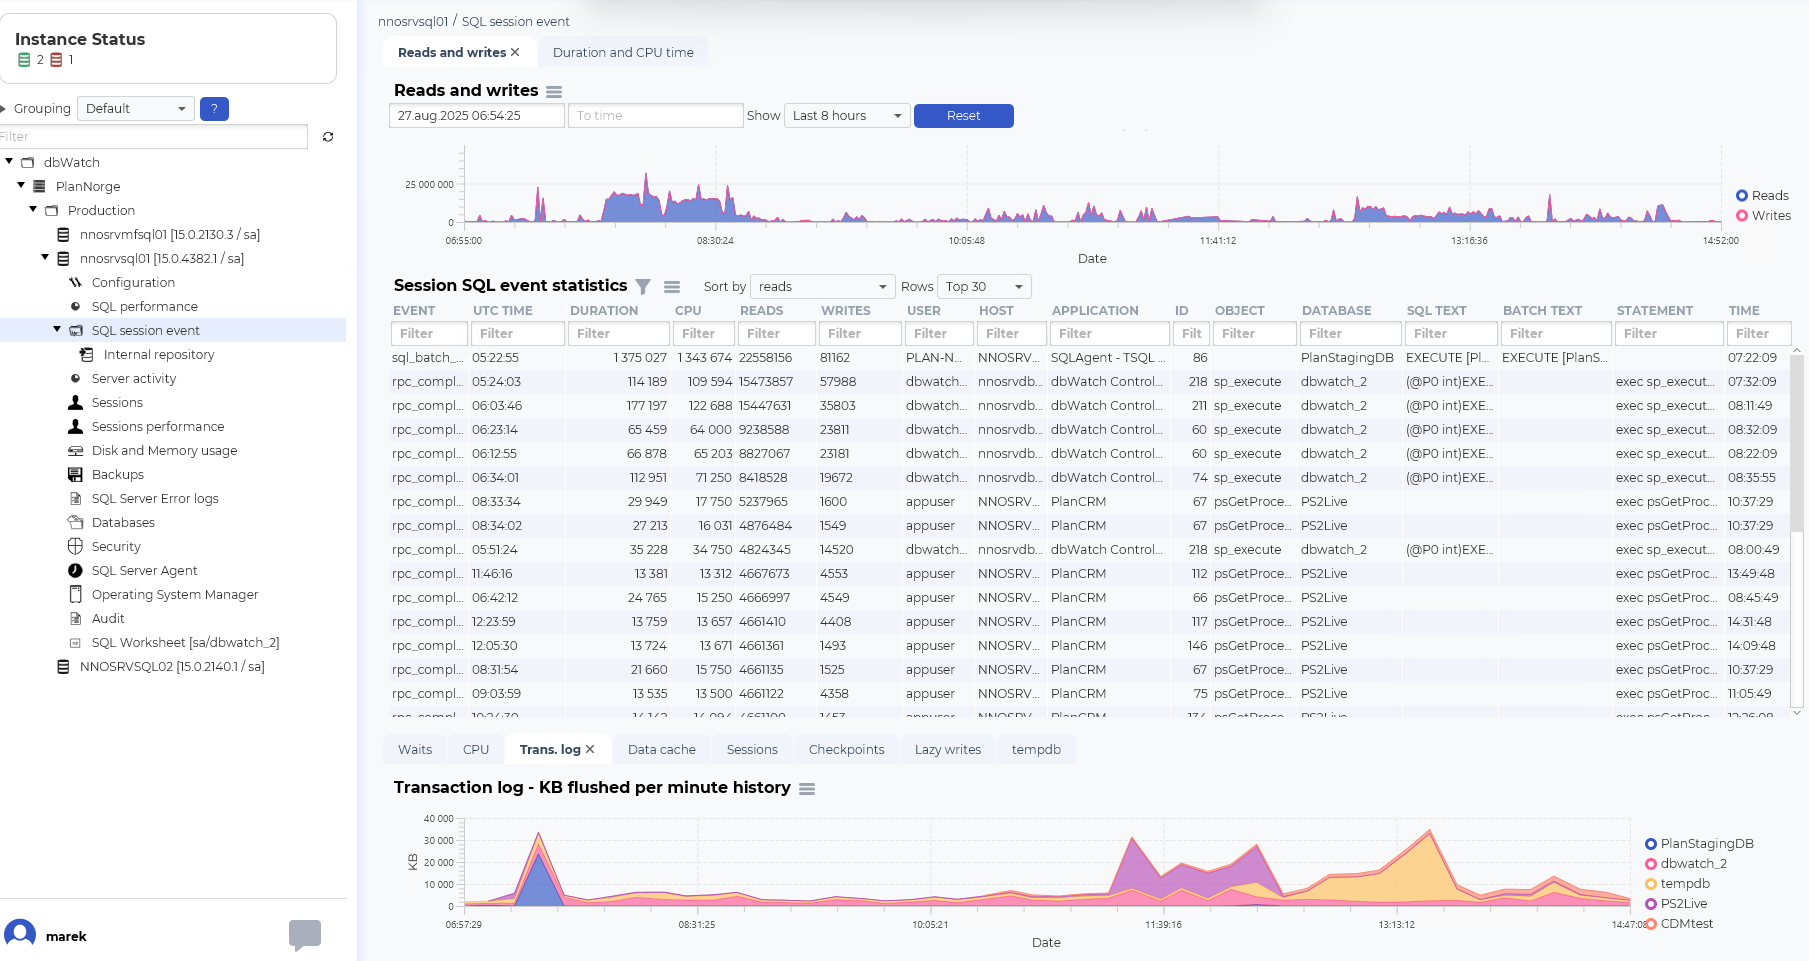
Once installed, the Session SQL Event Collector adds a new tree view entry named SQL session event.
Collected metrics are presented in a familiar, consistent layout similar to the SQL Performance module, enabling easy comparison and cross-analysis. DBAs can seamlessly navigate between cached plan metrics and session-level statistics for a full-spectrum view of system health.
Example main view: