Configuration & parameter descriptions
| Parameter | Default | Sqltype | Description |
|---|---|---|---|
| history threshold | 14 | Long | The number of days before the history record will be removed from the history table. |
| blocked threshold | 10 | Integer | Sets the SQL Server “blocked process threshold (s)” to this value if different, defining the minimum duration (in seconds) for a blocking situation to be reported. SQL Server parameter “show advanced options” must be enabled. Value in seconds. |
| patch | Text | Specifies the full path where event data will be stored. The name of the file is “dbWatchBlockingSessionStatsXE”. This file will receive all captured events for later analysis. | |
| max file size | 5 | Integer | Defines the maximum size (in MB) that a single event file can grow to before a new file is created or the rollover policy is applied (must be 11 MB or or higher). |
| max rollover files | 20 | Integer | Specifies the maximum number of event files to retain. When this limit is reached, the oldest file is deleted to make room for new data. |
| return status | 1 | Integer | Return status value (ALARM = 2, WARNING = 1, or OK = 0) when either the maximum size of the repository history table (parameter “repository max size”) is reached or the job execution time exceeds the defined threshold (parameter “max execution time”). This value indicates the current state and can be used to trigger alerts or monitor job health.) |
| repository max size | 500 | Integer | Defines the maximum size (in MB) of the repository history table before a warning or alarm is triggered. |
| max execution time | 60 | Integer | Specifies the maximum allowed execution time (in seconds) for the job. If the job runs longer than this threshold, a warning or alert is triggered. |
| XE file read interval | 5 | Integer | Controls how frequently the Extended Events (.xel) file is read from disk for blocked session analysis (in minutes). |
Example configuration
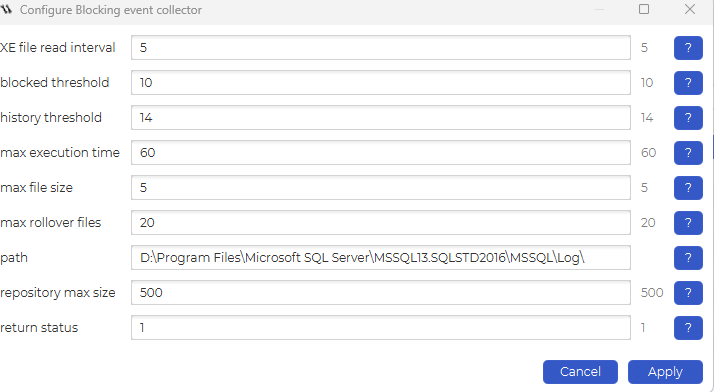
Example
Overview
The Blocking Events view in dbWatch Management provides a comprehensive, historical overview of SQL Server blocking activity. It combines visual graphs and detailed event data collected by the Blocking Event Collector job, enabling efficient analysis of blocking scenarios.
Navigation
Access Path
In dbWatch Management, navigate to:
Server activity → Blocking events
This section displays all collected blocking data for the selected instance.
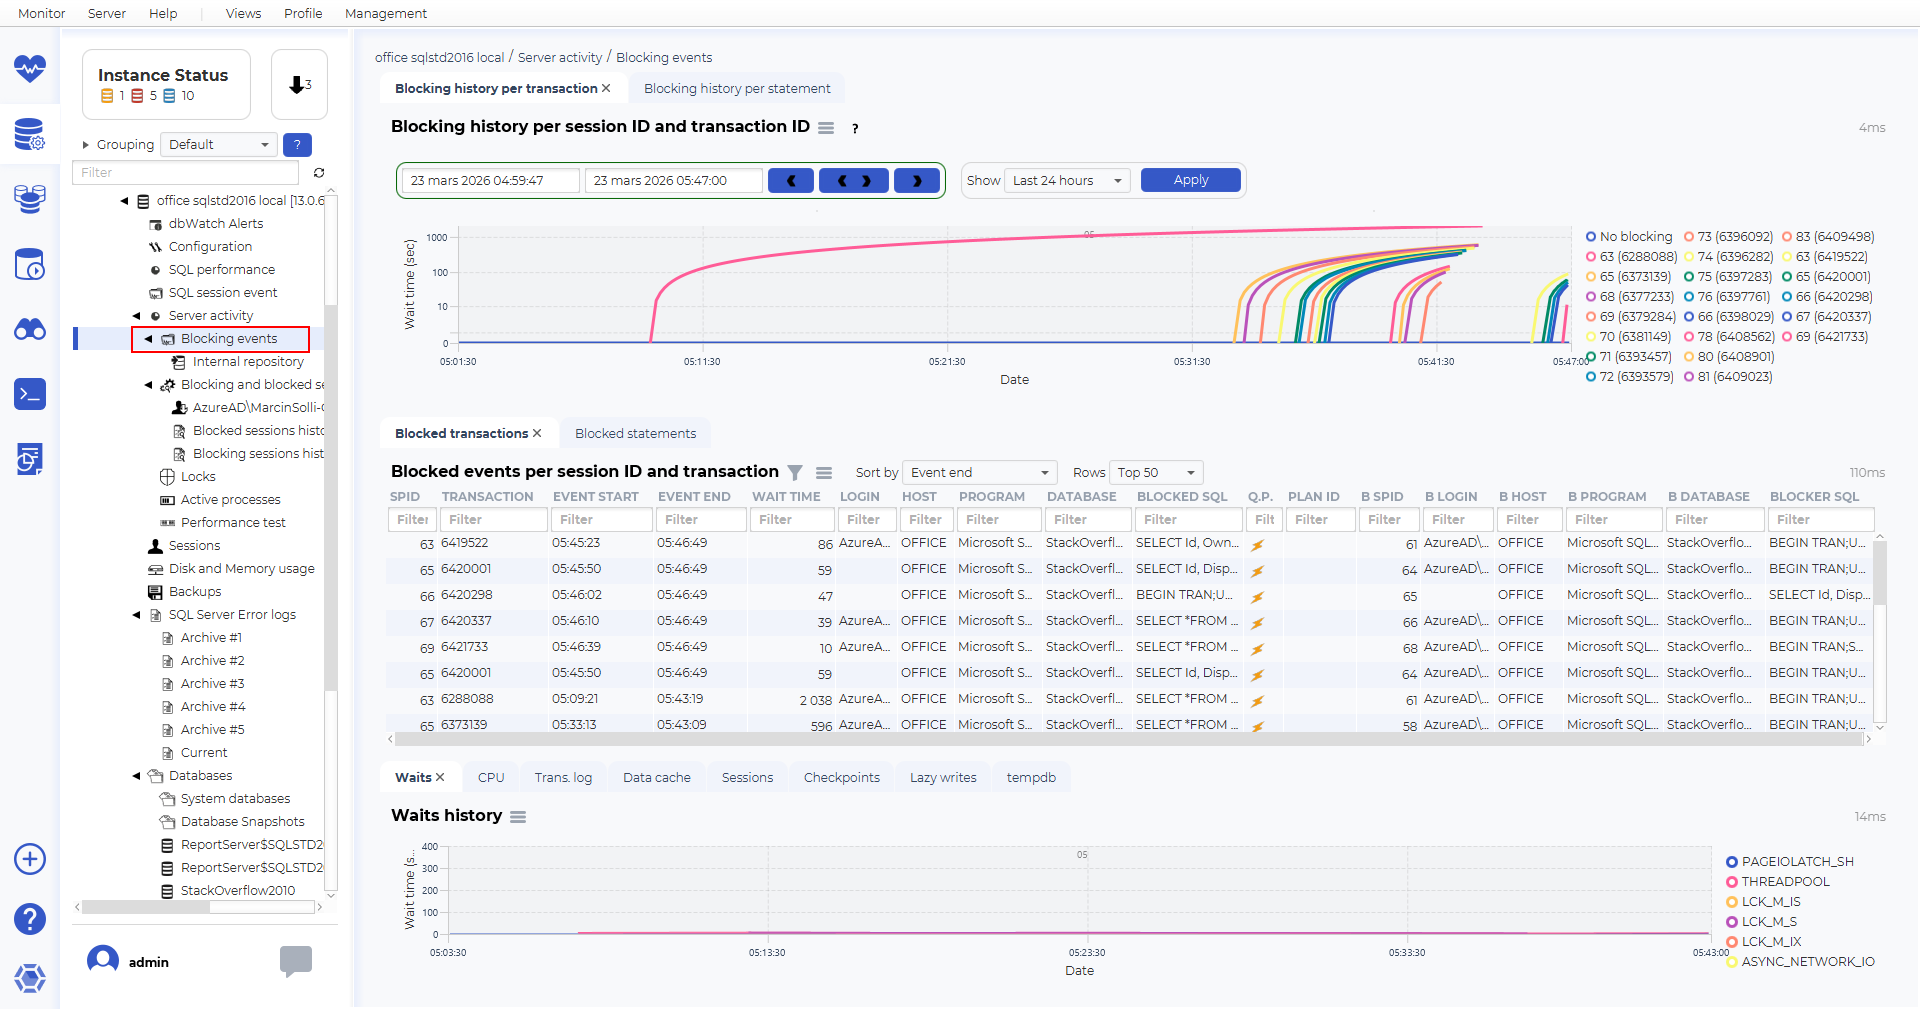
Top Section – Blocking History Graph
Blocking History per Transaction
The top graph shows blocking history over time, grouped by:
Session ID
Transaction ID
Each colored line represents a blocking chain or session.
Key Insights
The Y-axis shows wait time (seconds)
The X-axis shows time
Long curves indicate prolonged blocking
Multiple lines indicate parallel blocking events
This visualization helps identify:
When blocking started
How long it lasted
Whether multiple sessions were involved
Time Filter Controls
Time Range Selection
At the top, you can:
Select a time window
Navigate backward/forward in time
Apply filters such as Last 24 hours
This allows focused analysis of specific incidents.
Middle Section – Blocking Events Table
Blocked Events per Session and Transaction
This table contains detailed information about each blocking event.
Key Columns
SPID – Blocked session ID
Transaction ID – Transaction involved
Event Start / End – Duration of blocking
Wait Time – Total time blocked
Login / Host / Program – Session origin
Database – Affected database
Blocked SQL – Query being blocked
Blocker SPID – Blocking session
Blocker SQL – Query causing the block
Execution Plans
The ⚡ icon indicates that a query plan is not available
You can retrieve execution plans for analysis
Supports multiple query plans per blocking event, especially in complex blocking chains
This allows analysis of both the blocking and blocked queries at the execution plan level.
Bottom Section
Waits History
CPU History
Trans log History usage
Data cache History
Sessions History
Checkpoints History
Lazy writes History
Tempdb usage History
Purpose
Helps correlate blocking with dbWatch jobs
How to Use This View
Typical Analysis Workflow
Identify spikes or patterns in the top blocking graph
Adjust the time window to isolate the issue
Analyze affected sessions in the events table
Compare with wait statistics in the bottom graph
Review queries and execution plans for root causeSummary
Summary
The Blocking Events view provides:
A visual timeline of blocking activity
Detailed event-level and session-level data
Access to execution plans (including multiple per event)
Correlation with wait statistics over the same time window
It is a powerful tool for diagnosing and resolving SQL Server blocking issues in dbWatch.
See also
Adding EVENT SESSION functionality