Configuration / Parameter descriptions
Parameter: database filter
Default value: (blank)
sqltype: 0 (text)
Description: Specifies the list of databases to which the collector should apply. The value can be provided as a comma-separated list of database names. Wildcards () are supported to match multiple databases by pattern (e.g., %Sales to include all databases with “Sales” in their name).
Parameter: history threshold
Default value: 7
sqltype: 6 (long)
Description: The number of days before the history record will be removed from the history table.
Parameter: max duration time
Default value: 200
sqltype: 5 (integer)
Description: Max Duration Time specifies the threshold for capturing SQL batches and RPC calls. Only queries with execution time equal to or exceeding this value (in microseconds) are logged, allowing flexible adjustment of monitoring sensitivity.
Parameter: path
Default value: (blank)
sqltype: 0 (text)
Description: Specifies the full path where event data will be stored. The name of the file is “dbWatchSessionStatsXE”. This file will receive all captured events for later analysis.
Parameter: max file size
Default value: 20
sqltype: 5 (integer)
Description: Defines the maximum size (in MB) that a single event file can grow to before a new file is created or the rollover policy is applied (must be 11 MB or higher).
Parameter: max rollover files
Default value: 10
sqltype: 5 (integer)
Description: Specifies the maximum number of event files to retain. When this limit is reached, the oldest file is deleted to make room for new data.
Parameter: return status
Default value: 1
sqltype: 5 (integer)
Description: Return status value (ALARM = 2, WARNING = 1, OK = 0) when either the maximum size of the repository history table (parameter “repository max size”) is reached or the job execution time exceeds the defined threshold (parameter “max execution time”). This value indicates the current state and can be used to trigger alerts or monitor job health.
Parameter: repository max size
Default value: 1000
sqltype: 5 (integer)
Description: Defines the maximum size (in MB) of the repository history table before a warning or alarm is triggered.
Parameter: max execution time
Default value: 60
sqltype: 5 (integer)
Description: Specifies the maximum allowed execution time (in seconds) for the job. If the job runs longer than this threshold, a warning or alert is triggered.
Exemple configuration:
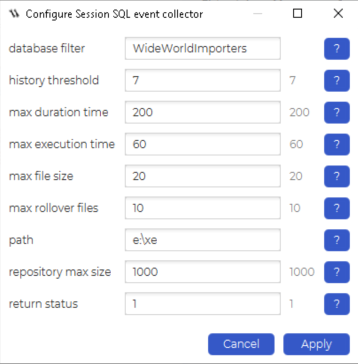
Quick checklist
Create the folder at the configured path and grant write permissions to the SQL Server service account.
Confirm that event files roll over according to Max file size and Max rollover files.
Monitor repository growth, increase the duration threshold or reduce retention if needed
Exemple – Correlate an event (Session 74) with SQL Performance in dbWatch
Scenario
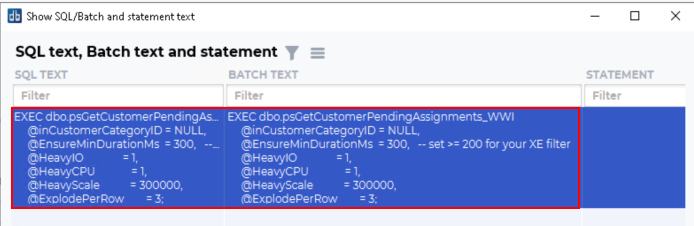
We see that Session 74 executed the stored procedure:
EXEC dbo.psGetCustomerPendingAssignments_WWI
In the Session SQL Event Collector we have “SQL text”, “Batch text”, and the usual session attributes (session id, database, app, host, login, timestamps, etc.). We’ll use the procedure name to inspect its performance in the SQL Performance module.
Steps
Identify the hit in the Event Collector
Open the Session SQL Event Collector view.
Locate the event for SessionId = 74 showing EXEC dbo.psGetCustomerPendingAssignments_WWI.
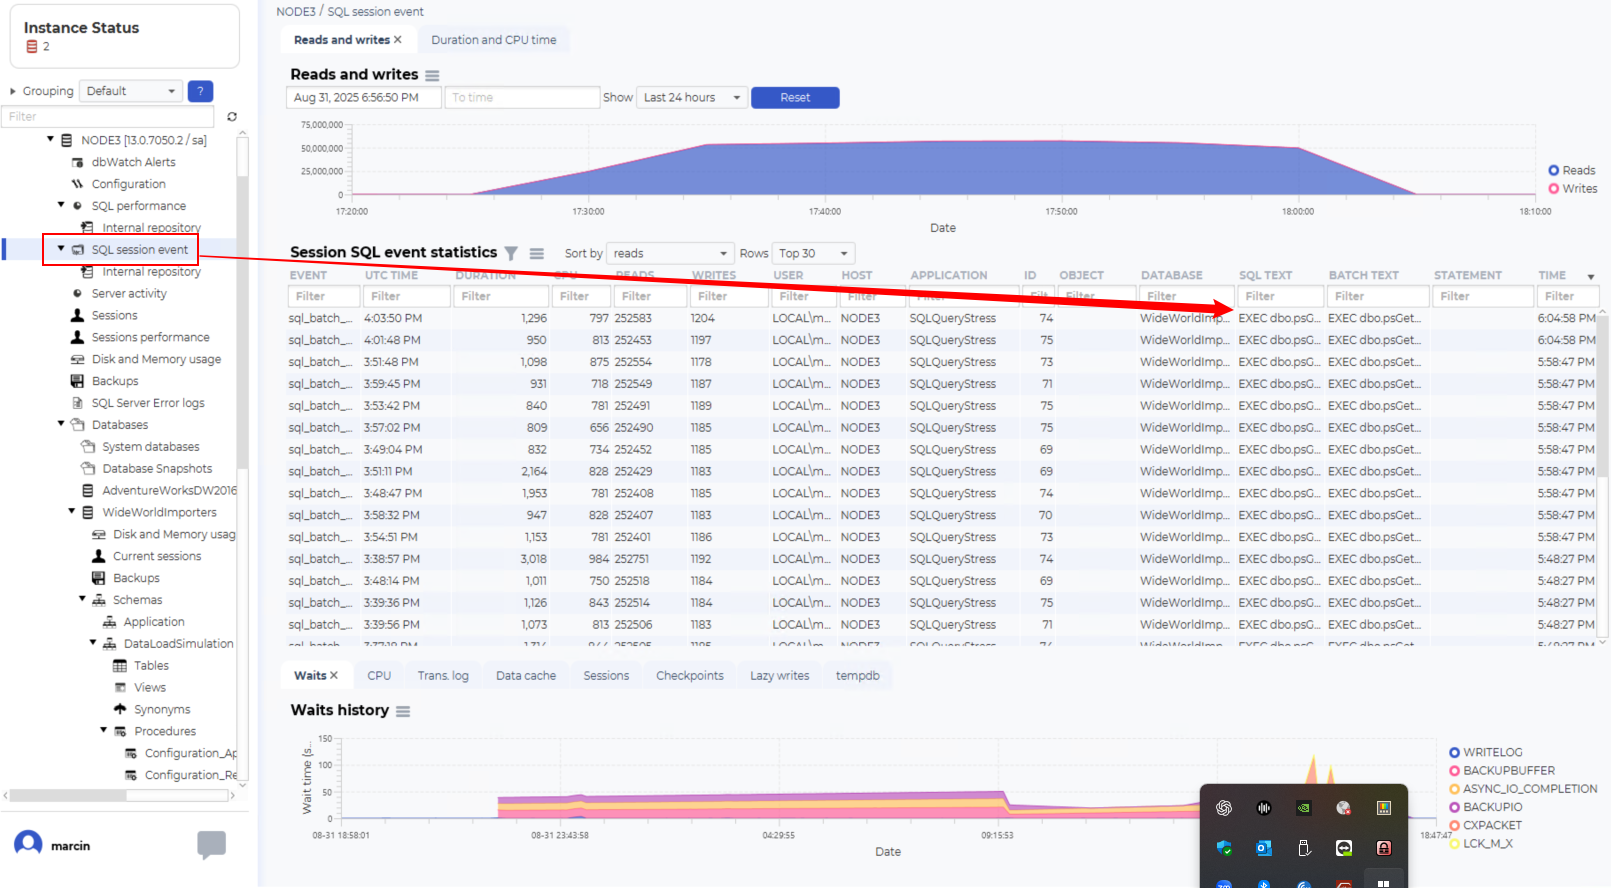
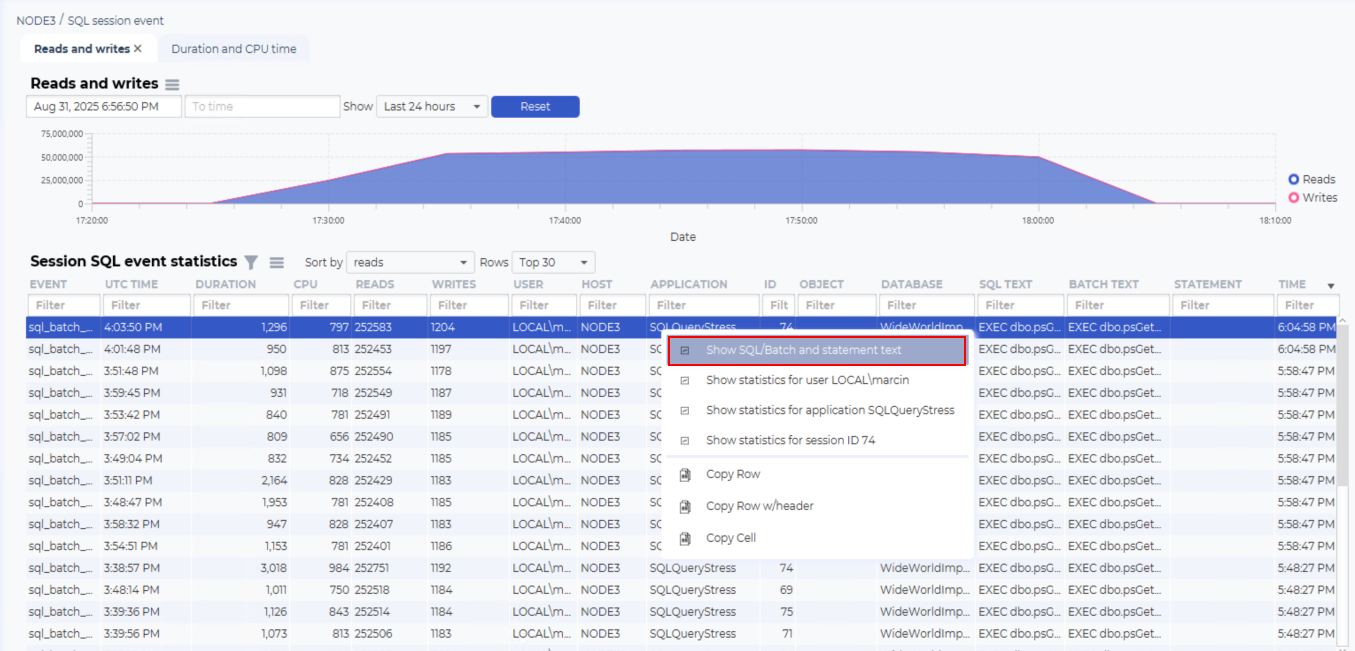
Note the timestamp and any helpful context (database, application, host, login).
Open SQL Performance and search for the procedure
Go to “SQL Performance”.
Right-click any row and choose “Find text…”.
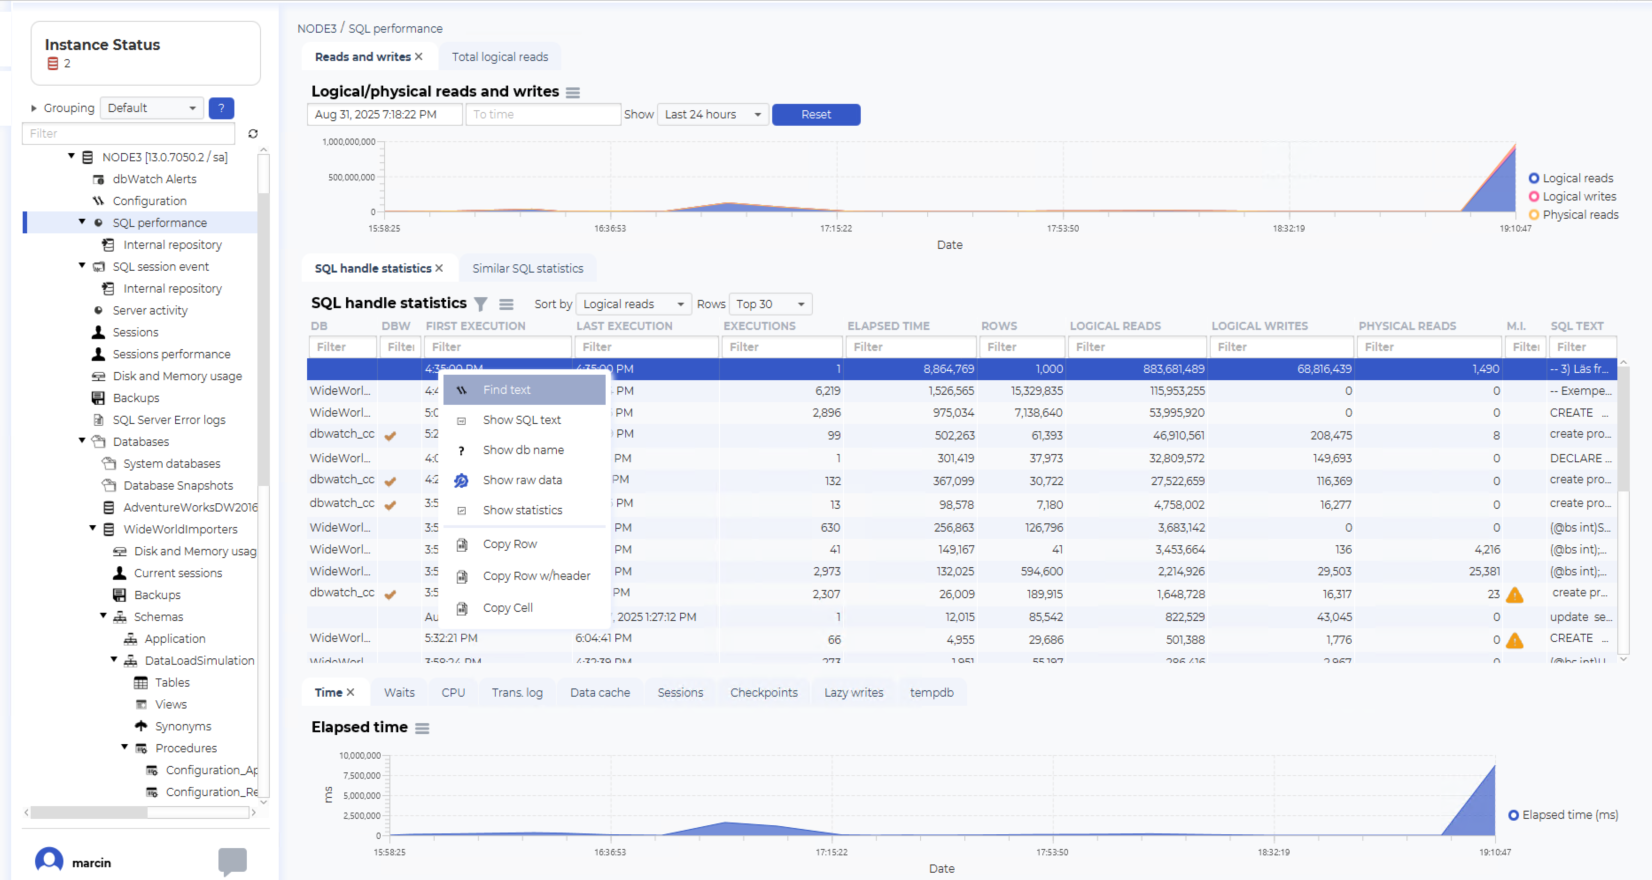
Enter stored procedure name: exemple psGetCustomerPendingAssignments_WWI
(Tip: if you get no results, try psGetCustomerPendingAssignments_WWI or use a wildcard like psGetCustomerPendingAssignments.)
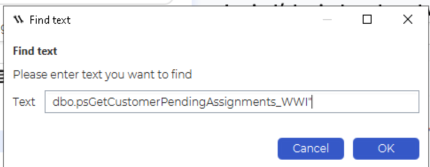
Click “OK”.
Review the results
You should now see the collected records where this procedure appeared.
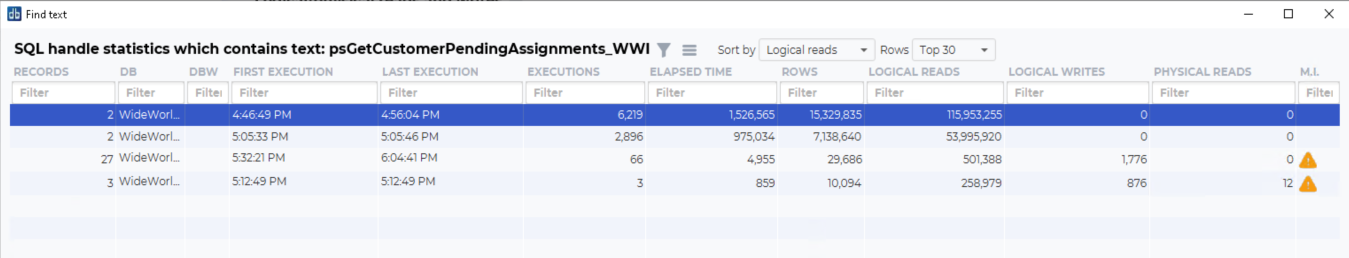
Align the time window with the timestamp from Step 1 to ensure you’re looking at the same period.
Inspect key metrics (e.g., executions, average/max duration, CPU time, reads/writes, last execution time) to understand the procedure’s behavior.
Drill down and correlate
Sort by duration or CPU to find the worst intervals.
Compare the peak times here with the timestamps from the Event Collector entry for Session 74.
Use the context (database, app, host, login) to confirm it’s the same workload and identify the calling application or user.
Expected outcome
You can see when and how dbo.psGetCustomerPendingAssignments_WWI was used, quantify its cost (duration/CPU/IO), and tie specific slow executions back to the event you saw for Session 74.
If nothing shows up
Widen the time range in SQL Performance to include the Event Collector timestamp.
Try the search without the schema or with wildcards.
Confirm the SQL Performance/statistics collector is running and hasn’t trimmed history beyond your retention settings.