Troubleshooting issues in SQL Performance package
Graph issues with monitoring has been switched off
If for some reason dbWatch Control Center has not been connected to a database instance running SQL Performance package for an extended time, you can get odd statistics errors in the graphs. It will look like a linear gradual increase in number. This is due to statistics being based on a ever-increasing value, and we take snapshots of this value to determine the changes in a period.
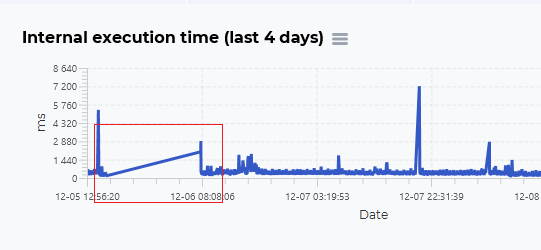
Note that the internal execution time graph here displays this problem.
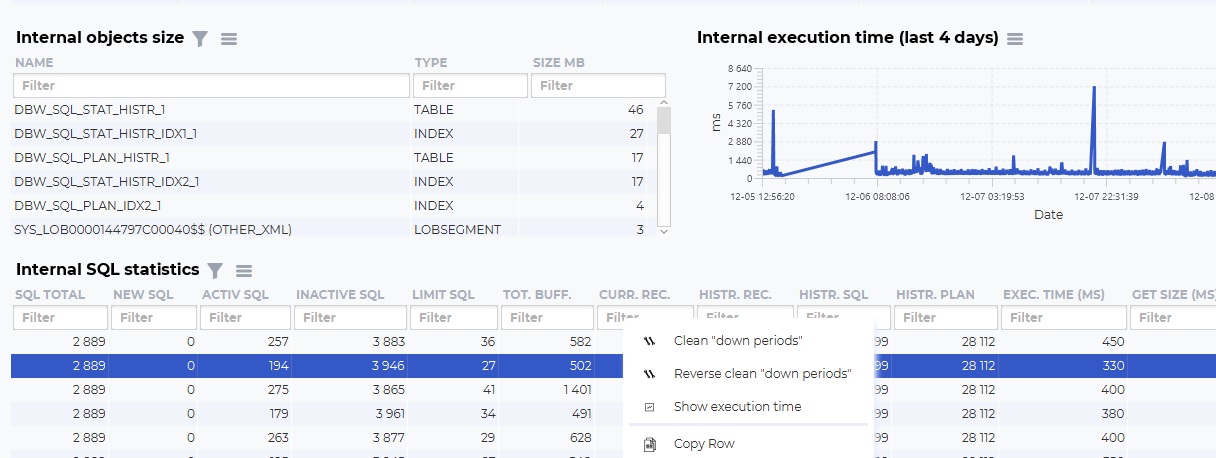
If you right-click on the “Internal SQL statistics” table, you can choose to “Clean down periods” to recalculate this correctly.
After this cleaning, the graph will look more like this:
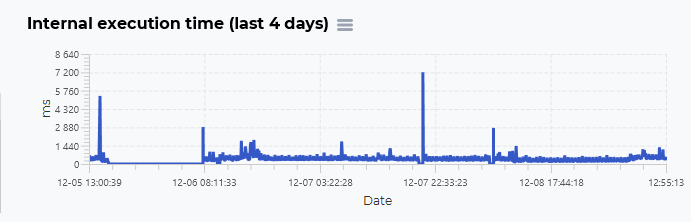
Where the data is modified to express that we have no values in this time period.