Configuring Microsoft Teams Status Integration
This guide describes how to configure dbWatch Control Center (dbWatch CC) to post a combined instance status report to a Microsoft Teams channel.
The integration uses dbWatch dashboard web exports to retrieve monitoring information in JSON format.
A PowerShell script reads the exported data, creates a status summary, and posts the result to Microsoft Teams using a Teams Workflow webhook.
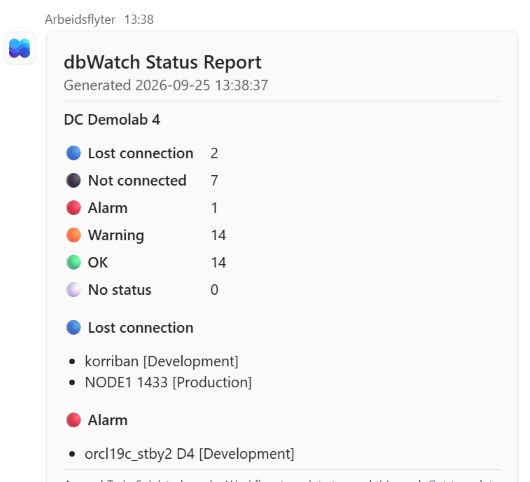
The report includes:
- Overall instance status counts
- Instances with status LOST CONNECTION
- Instances with status ALARM
Warnings and other statuses are included in the summary count, but only ALARM and LOST CONNECTION instances are listed individually.
This keeps the Teams report concise even when monitoring a large number of instances.
Microsoft Teams Notifications
The integration uses the following data flow:
dbWatch CC → Dashboard Web Export (JSON) → PowerShell script → Teams Workflow webhook → Microsoft Teams channelUnlike the Slack integration, CCC is not required. The PowerShell script retrieves the data directly from the dbWatch web server.
What’s included
-   PowerShell script
	** Example PowerShell script for retrieving the dbWatch JSON exports and posting an Adaptive Card to Teams
-   dbWatch dashboards
	** Instance status — provides the overall status counts
	** Teams Integration — provides the ALARM and LOST CONNECTION instance list
-   Teams Workflow
	** Receives the HTTP POST request from the PowerShell script and posts the Adaptive Card to the selected Teams channel
The example PowerShell script is available from GitHub:
GitHub link
Prerequisites
- dbWatch Control Center with the web server enabled
- Web data export configured in dbWatch CC for unattended access to the dashboard JSON exports
- Network access from the host running the PowerShell script to the dbWatch web server
- PowerShell
- Outbound HTTPS access to Microsoft Teams / Power Automate
- Access to a Microsoft Teams channel where a Workflow can be created
- A Teams Workflow configured with the When a Teams webhook request is received trigger
The Teams webhook URL should be treated as a credential and should not be shared publicly.
dbWatch dashboard configuration
The integration uses two dashboard web exports.
Instance status
The Instance status dashboard is installed by default with dbWatch Control Center.
The status overview used by the integration is based on the following FDL query:
instance->i/groupby(status/id)->s/$s/_1{}/count($i)Example JSON result:
   {
	"columns":["FArgOne", "FCount($i)"],
	"data":[
		["LOST CONNECTION", "2"],
		["NOT CONNECTED", "7"],
		["OK", "16"],
		["WARNING", "12"],
		["ALARM", "1"]
	]
    }
This query provides the overall number of instances in each state.
Teams Integration
A second dashboard is used to retrieve the short instance list for ALARM and LOST CONNECTION.
Create a dashboard, for example named Teams Integration, containing a table based on the following FDL query:
instance[status='ALARM' | status='LOST CONNECTION']->i/$i/status/id{}/$i/name{}/$i/group{}The exported columns are:
- Status
- Instance name
- Instance group
Example JSON result:
   {
	"columns":["FId", "FName", "FGroup"],
	"data":[
		["LOST CONNECTION", "korriban", "Development"],
		["LOST CONNECTION", "NODE1 1433", "Production"],
		["ALARM", "orcl19c_stby2 D4", "Development"]
	]
    }
Only ALARM and LOST CONNECTION instances are returned.
Task-level alarm details and WARNING tasks are intentionally not included, as these can produce a very large report on systems with many monitored instances.
Configure Web data export
Before using the dashboard JSON URLs, configure Web data export in dbWatch Control Center as described in:
Exporting data: tutorial
Web data export should be configured for the dashboards used by the integration so that the PowerShell script can retrieve the exported JSON data without interactive authentication.
If Web data export is not configured, authentication is required when accessing the dashboard data, and the PowerShell integration must provide the required dbWatch credentials.
After configuring Web data export, verify that both JSON URLs can be accessed from the server where the PowerShell script will run.
For example:
Invoke-RestMethod -Uri "<dbwatch-json-url>"The command should return the dashboard JSON data without prompting for credentials.
Create the web export URLs
For each dashboard table, enable or identify the JSON web export URL.
The URLs will typically have a format similar to:
http://<dbwatch-server>:8081/dashboard/<dashboard-name>/data/<id>.jsonFor example:
http://localhost:8081/dashboard/Teams%20Integration/data/3_uKMNEvRp.jsonThe PowerShell script requires two URLs for each monitored dbWatch environment:
- Status summary URL
- ALARM / LOST CONNECTION details URL
The web export URLs should be tested in a browser or with PowerShell before configuring the Teams integration.
For example:
Invoke-RestMethod -Uri "<dbwatch-json-url>"Configure Microsoft Teams
For new integrations, use the Teams Workflows app rather than the older Microsoft 365 Connectors.
To create the webhook:
- Open Microsoft Teams.
- Go to the Team and channel where the dbWatch report should be posted.
- Select the menu for the channel.
- Select Workflows.
- Search for and select Send webhook alerts to a channel, or create a workflow using the When a Teams webhook request is received trigger.
- Select the Team and channel where the message should be posted.
- Save the workflow.
- Copy the generated webhook URL.
The generated URL is used by the PowerShell script when posting the dbWatch status report.
It is recommended to test the webhook before configuring the complete integration.
Example:
$WebhookUrl = "<Teams Workflow webhook URL>"
    $body = @{
        text = "Test message from dbWatch"
    } | ConvertTo-Json
    Invoke-RestMethod `
        -Uri $WebhookUrl `
        -Method Post `
        -ContentType "application/json" `
        -Body $body
The test message should appear in the selected Teams channel.
Configure monitored dbWatch environments
Create customers.ini in the same directory as the PowerShell script.
Each line contains:
<CUSTOMER>,<STATUS_URL>,<DETAILS_URL>Example:
DC AlphaLab,http://dbwatch01:8081/dashboard/Instance%20status/data/<id>.json,http://dbwatch01:8081/dashboard/Teams%20Integration/data/<id>.jsonMultiple lines can be added when the script should collect information from several dbWatch environments.
Comment lines starting with # and empty lines are ignored.
Configure the Teams webhook
Configure the generated Teams Workflow webhook URL in the PowerShell
script:
$TEAMS_WEBHOOK_URL = "https://<Teams-Workflow-webhook-url>"The URL should be protected in the same way as other credentials.
Run the integration
Run the PowerShell script manually before scheduling it:
Set-ExecutionPolicy Bypass -Scope Process -Force
.\dbWatchTeamsStatus.ps1
The script:
- Reads the status-count JSON export.
- Reads the ALARM / LOST CONNECTION JSON export.
- Displays the collected information in the PowerShell console.
- Creates a combined Microsoft Teams Adaptive Card.
- Posts the card to the configured Teams Workflow webhook.
Example output:
Status changes
The example script stores a hash of the previously reported status.
If the monitoring status has not changed since the previous run, no new Teams message is posted.
When the status changes, a new report is posted.
This avoids repeatedly posting identical status reports to the Teams channel.
Unlike the Slack integration, the Teams Workflow webhook does not delete the previous message before posting a new one. The Teams channel therefore provides a history of status changes.
Limiting large reports
For environments with many instances, the number of individually listed ALARM and LOST CONNECTION instances can be limited in the PowerShell script.
For example:
$MAX_DETAILS_PER_STATUS = 20The overall status count always shows the complete number, while the detail section displays the first configured number of instances followed by a message indicating that additional instances exist.
Scheduling
Windows: Use Windows Task Scheduler to run the PowerShell script at the required interval.
For example, the integration could be scheduled every 5, 10, or 15 minutes depending on how frequently Teams status updates are required.
Data flow
dbWatch CC
        |
        +-- Instance status dashboard
        |       |
        |       +-- Status counts JSON
        |
        +-- Teams Integration dashboard
                |
                +-- ALARM / LOST CONNECTION JSON
                        |
                        v
                  PowerShell script
                        |
                        v
              Teams Workflow webhook
                        |
                        v
              Microsoft Teams channel
Troubleshooting
- No data returned from dbWatch: Test both JSON export URLs directly using a browser or Invoke-RestMethod.
- Authentication/password required: Verify that Web data export is configured for unattended access as described in the Exporting data tutorial.
- Teams message is not posted: Test the Teams Workflow webhook with a simple text message.
- Workflow not available: Verify that the Workflows app and Power Automate are enabled for the Microsoft 365 organization.
- dbWatch connection error: Verify that the machine running the PowerShell script can connect to the dbWatch web server and port.
- Large Teams messages: Reduce $MAX_DETAILS_PER_STATUS. The complete monitoring information remains available in dbWatch CC.
- Workflow stops working after an account change: Verify the workflow owner and connections in Teams/Power Automate. For production integrations, consider configuring additional workflow owners.