Integrating dbWatch Data into Excel
This guide describes how to extract data using dbWatch Control Center, expose it through dbWatch Web data export, and connect the exported CSV data to Microsoft Excel.
Web Export to Excel
Using dbWatch Control Center and dbWatch Web, database data can be exposed as CSV and imported directly into Excel. Excel can then refresh the data automatically and use it for analysis, PivotTables, charts, formulas, and other reporting.
Prerequisites
- Microsoft Excel (2016 or later recommended)
- dbWatch Control Center
- URL of the CSV data from the dbWatch web server
- Basic understanding of SQL and Excel functions
Step 1: Identify the SQL used to retrieve data
The first step is to create an SQL query that retrieves the required data from the database.
The following example retrieves database size and history information:
select
t2.db_file_size+t2.tr_log_size size ,
t1.db_name "Database name",
t2.histr_date "History date"
from dbwatch_cc..dbw_db_size_detailed t1, dbwatch_cc..dbw_db_size_histr_detailed t2
where t1.db_id=t2.db_id and t2.db_id in (select db_id from dbwatch_cc..dbw_db_size_ranks where tot_size_rank < 6)
union
select
db_file_size+tr_log_size ,
db_name,
histr_date
from dbwatch_cc..dbw_db_size_detailed
where db_id in (select db_id from dbwatch_cc..dbw_db_size_ranks where tot_size_rank < 6)
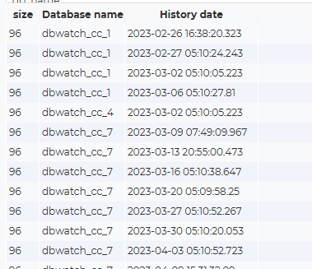
Example result set:
Step 2: Transform the SQL query to FDL
The SQL query must next be converted into FDL (Farm Data Language), which dbWatch uses to create the data export.
Example FDL configuration:
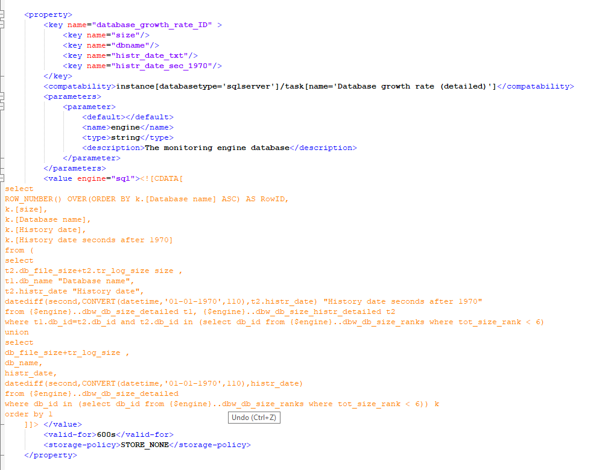
Import the property file sqlserver_database_growth_prop.xml into dbWatch Control Center using Server → Upload resource.
Step 3: Define a dashboard in dbWatch Web
To export the data, create a dashboard in dbWatch Web and add the FDL query as a data source.
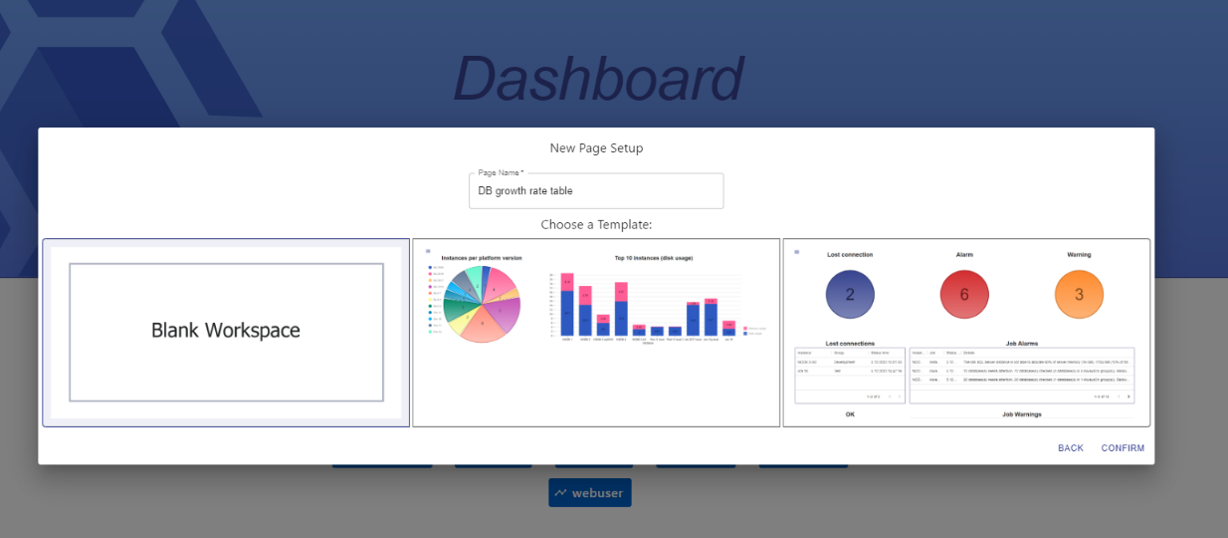
Create a new dashboard
Log in to the dbWatch Web server, navigate to the Dashboards section, and create a new dashboard.
Add the data source
Add the FDL query created in the previous step as a data source. In this example, the data is filtered on the instance named ms 19 local:
instance[name='ms 19 local']/database_growth_rate_ID->g
/$g/size{}
/$g/dbname{}
/$g/histr_date_txt{}
/$g/histr_date_sec_1970{}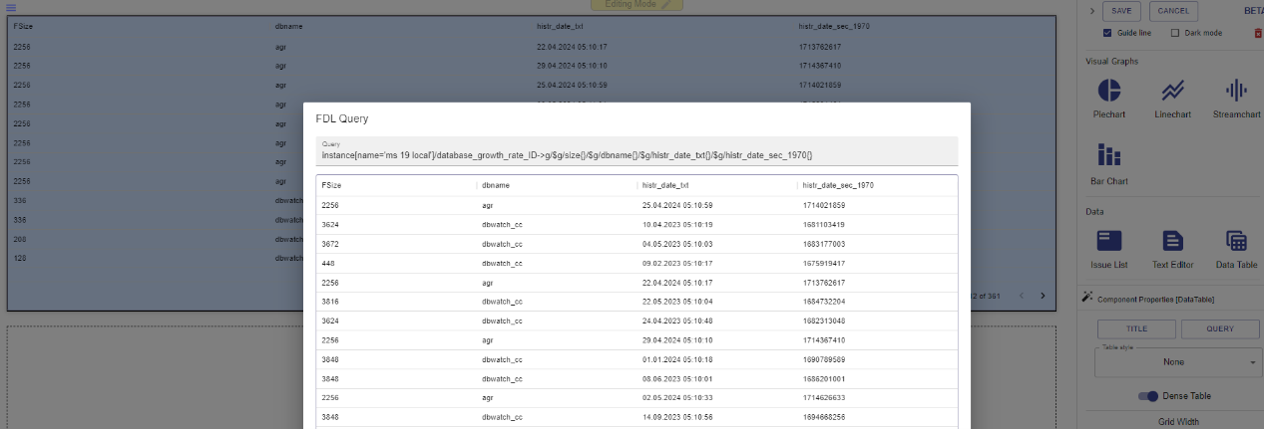
Configure Anonymous webaccess so that the dbWatch Web data export is available.
Web data export – Control Center – 1.0
Step 4: Connect Excel to the dbWatch dashboard
With the CSV data export configured in dbWatch, Excel can connect directly to the exported data.
Access the CSV data URL
Obtain the URL for the CSV data from the dashboard data export.
Example:
http://localhost:8080/dashboard/DB%20growth%20rate/data/NCnNEP19yN.csv
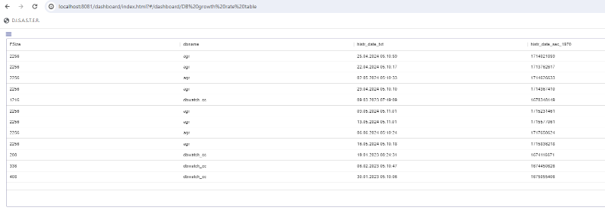
For more information about configuring the export URL, see:
Web data export – Control Center – 1.0
Import the web data into Excel
- Open Microsoft Excel.
- Select the Data tab.
- Select Get Data → From Other Sources → From Web.
- Enter the CSV data URL and click OK.
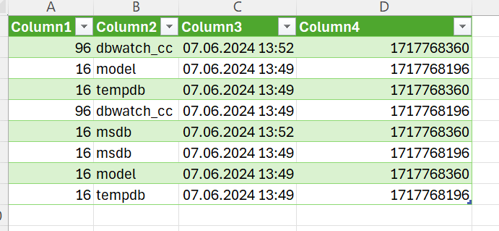
- Excel connects to the web server and displays a preview of the data.
- Click Load to import the data into a new worksheet, or use Load To to select another location in the workbook.
Convert Unix timestamps to Excel dates
If the exported data contains Unix timestamps, they can be converted into Excel date values.
- Locate the column containing the Unix timestamps.
- Insert a new column for the converted date.
- In the first cell of the new column, enter the following formula, assuming the Unix timestamp is in D2:
=((D2/86400) + DATE(1970,1,1))The formula divides the Unix timestamp by 86400, the number of seconds in a day, and adds the result to January 1, 1970, which is the start of the Unix epoch.
Select the cells containing the formula, right-click, select Format Cells, and choose a date format.
Automate data refresh
Excel can refresh the imported web data automatically at regular intervals.
- Open the Data tab and select Queries & Connections.
- In the Queries & Connections pane, right-click the query for the imported web data and select Properties.
- Enable Refresh every and specify the desired interval, for example every 60 minutes.
- Enable Refresh data when opening the file to load the latest data whenever the workbook is opened.
Data analysis and visualization
After importing the data and converting any Unix timestamps, Excel can be used to analyze and visualize the data.
- PivotTables: summarize and explore large datasets.
- Charts and graphs: visualize trends and patterns.
- Formulas and functions: manipulate and analyze the imported data.
Summary
By combining dbWatch Control Center Web data export with Excel’s web-data import and refresh features, database information can be imported into Excel and kept up to date automatically. This provides a simple way to build reports and visualizations based on current dbWatch data.