Line chart
A line chart example
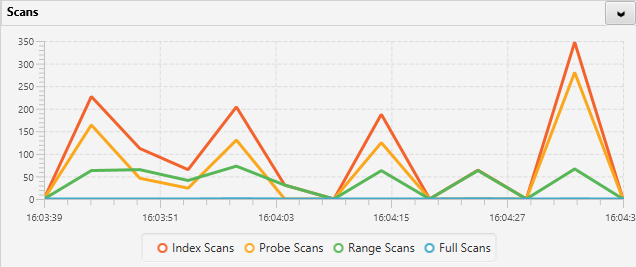
The specification for this chart:
<result>
	<sql>select
		(SELECT cntr_value FROM sys.dm_os_performance_counters
		where counter_name = 'Index Searches/sec') as "Index Scans",
		(SELECT cntr_value FROM sys.dm_os_performance_counters
		where counter_name = 'Probe Scans/sec') as "Probe Scans",
		(SELECT cntr_value FROM sys.dm_os_performance_counters
		where counter_name = 'Range Scans/sec') as "Range Scans",
		(SELECT cntr_value FROM sys.dm_os_performance_counters
		where counter_name = 'Full Scans/sec') as "Full Scans"
	</sql>
	<result-type>GRAPHICAL</result-type>
	<graphical>
		<title>Scans</title>
		<interval>5</interval>
		<dynamic>true</dynamic>
		<resultset>
			<column>
				<name>Index Scans</name>
				<sql-type>1</sql-type>
				<diff>1</diff>
				<label/>
			</column>
			<column>
				<name>Probe Scans</name>
				<sql-type>1</sql-type>
				<diff>1</diff>
				<label/>
			</column>
			<column>
				<name>Range Scans</name>
				<sql-type>1</sql-type>
				<diff>1</diff>
				<label/>
			</column>
			<column>
				<name>Full Scans</name>
				<sql-type>1</sql-type>
				<diff>1</diff>
				<label/>
			</column>
		</resultset>
		<line-chart>
			<to-plot>Index Scans</to-plot>
			<to-plot>Probe Scans</to-plot>
			<to-plot>Range Scans</to-plot>
			<to-plot>Full Scans</to-plot>
			<chart-type>5</chart-type>
		</line-chart>
	</graphical>
</result>