Network Layout
If you have a large dbWatch installation, it can become difficult to keep track of the network topology of the dbWatch Nodes (Servers, Monitors and Cloud Routers).
The Network Layout view gives you a live representation of the current network layout.
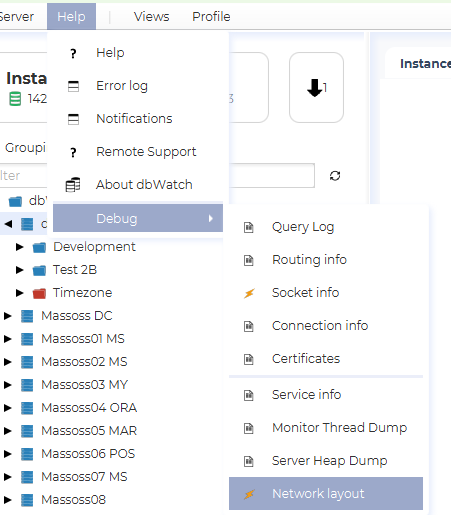
You can find it on the main menu under Help → Debug -> Network Layout.
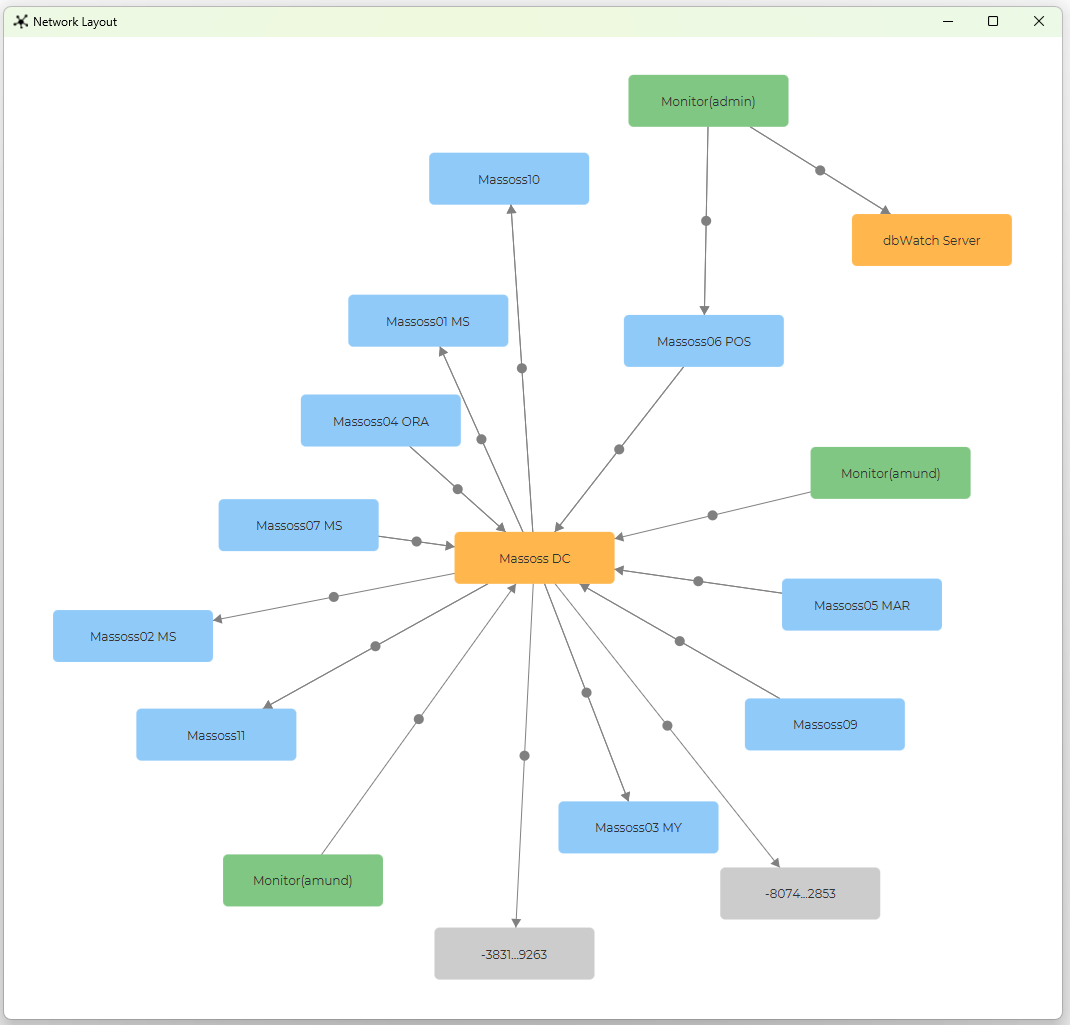
This opens the Network Layout view, where all the reachable Nodes are shown in a network graph.
The Nodes are colored according to their type, and arrows indicate the direction of the connection. The view can be zoomed in and out with the mouse wheel, and dragged around with the mouse.
In the example below, you see two dbWatch Domain Controllers, three dbWatch Monitors and a set of dbWatch Servers (and two unclassified nodes).
The nodes are colored according to their type, currently the available types are:
| Color | Node Type |
|---|---|
 |
dbWatch Server |
 |
dbWatch Monitor |
 |
dbWatch Domain Controller |
 |
dbWatch Cloud Router |
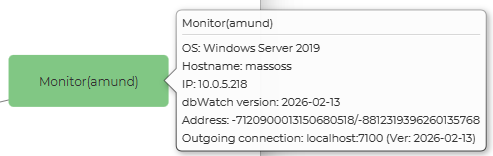
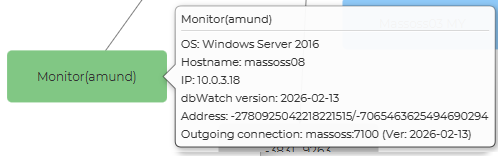
Hovering the mouse over a Node shows available information about the node, including the version, IP, OS type and connection info.
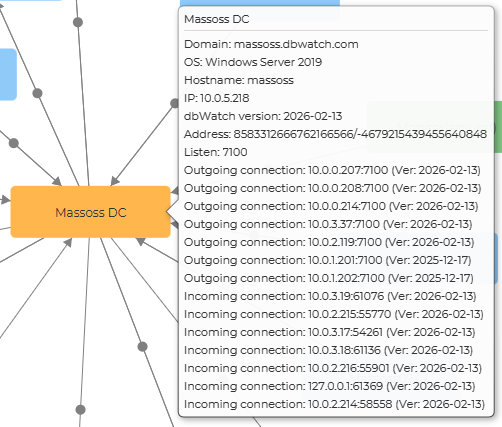
In the example there appears to be two dbWatch Monitors where a user called “amund” is connected to the “Massoss DC” Server.
But hovering on the Monitor nodes reveals that the Monitor is running on two different computers, with the same user logged in.
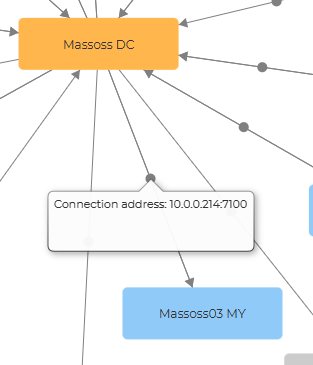
The connection arrows indicate the direction of the connection. Clicking on the dot in the middle of the arrow shows the url the connection is defined with.