Dashboards
Dashboard overview
The main page for the dashboards:
User and login
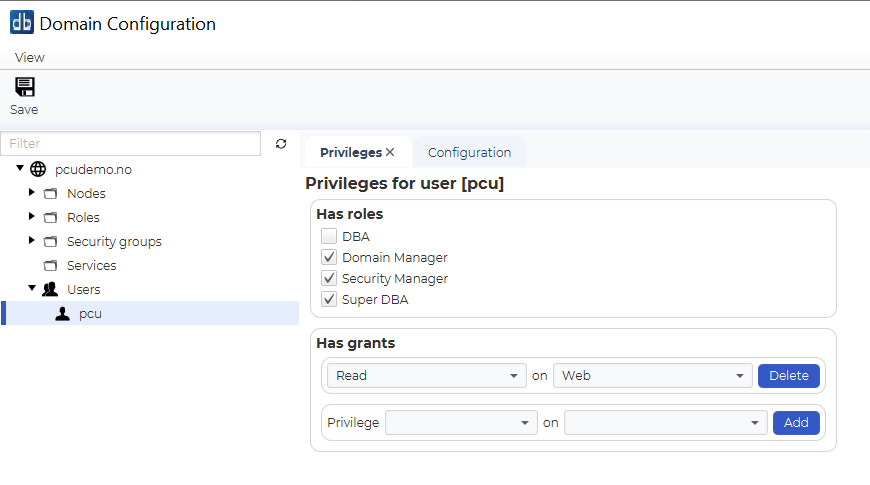
To view dashboards, you need to login with a user that has at least read privileges on web.
Default dashboards
These are the default dashboards:
Instance status:
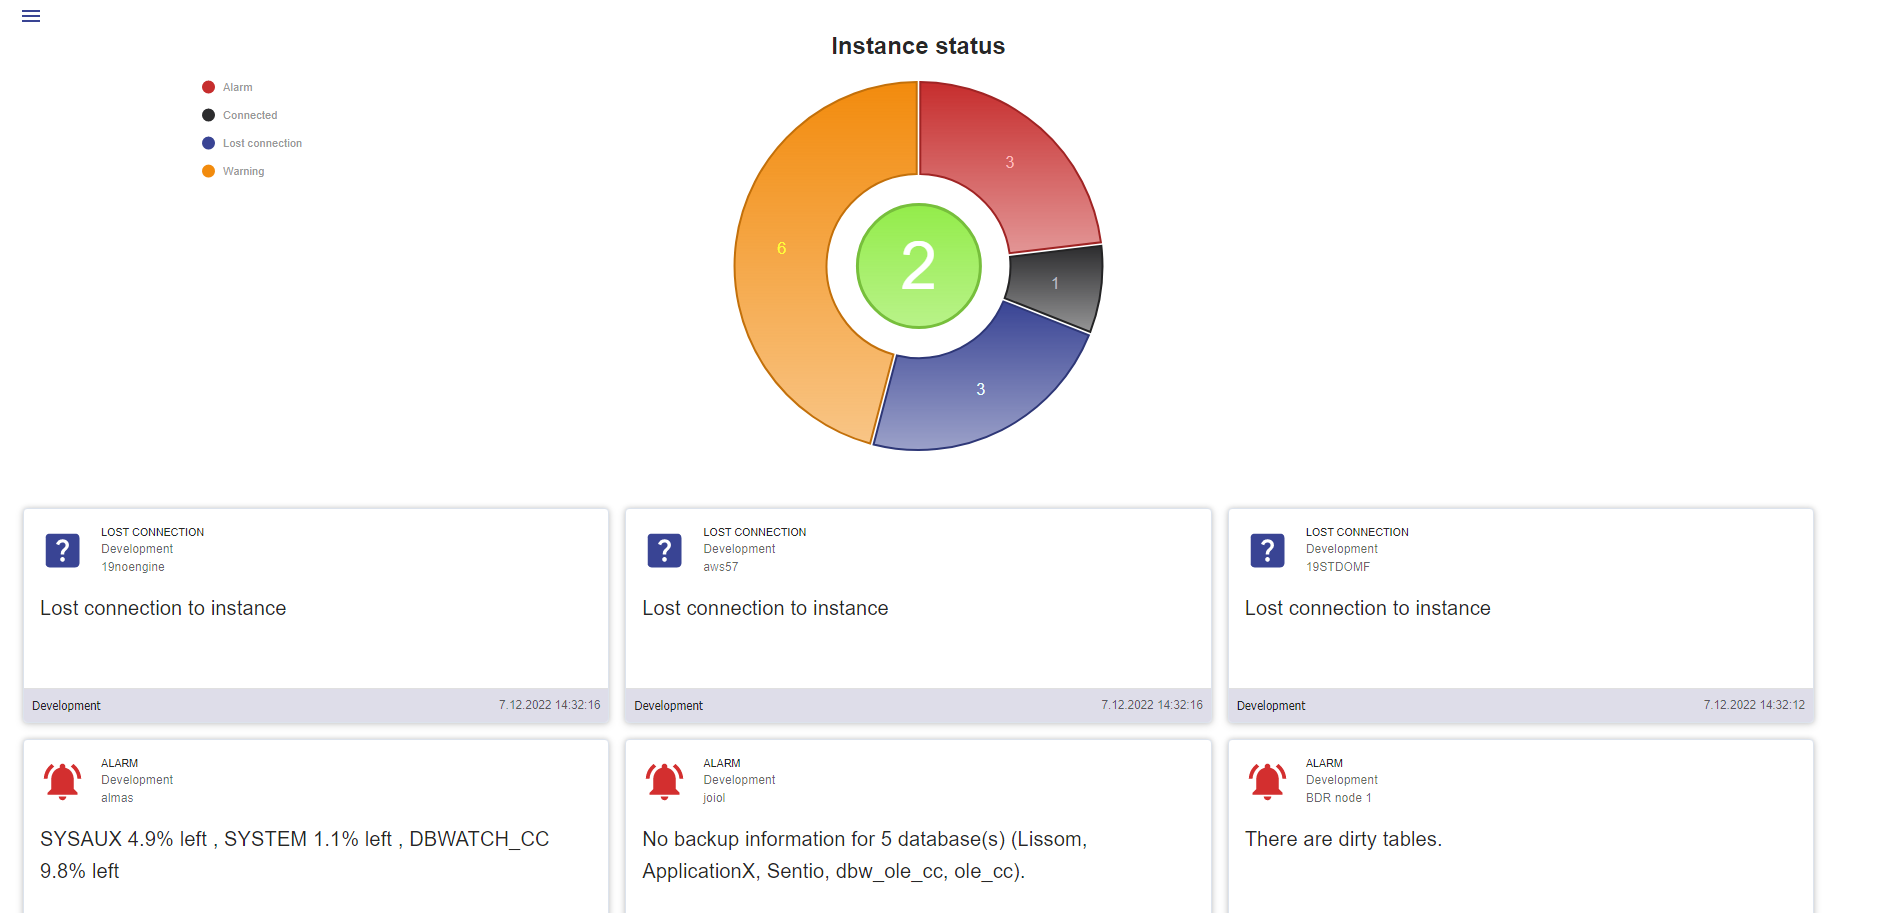
This dashboard visualizes the number of instances in different status, and also an issue list from all instances on this server.
Issue list:
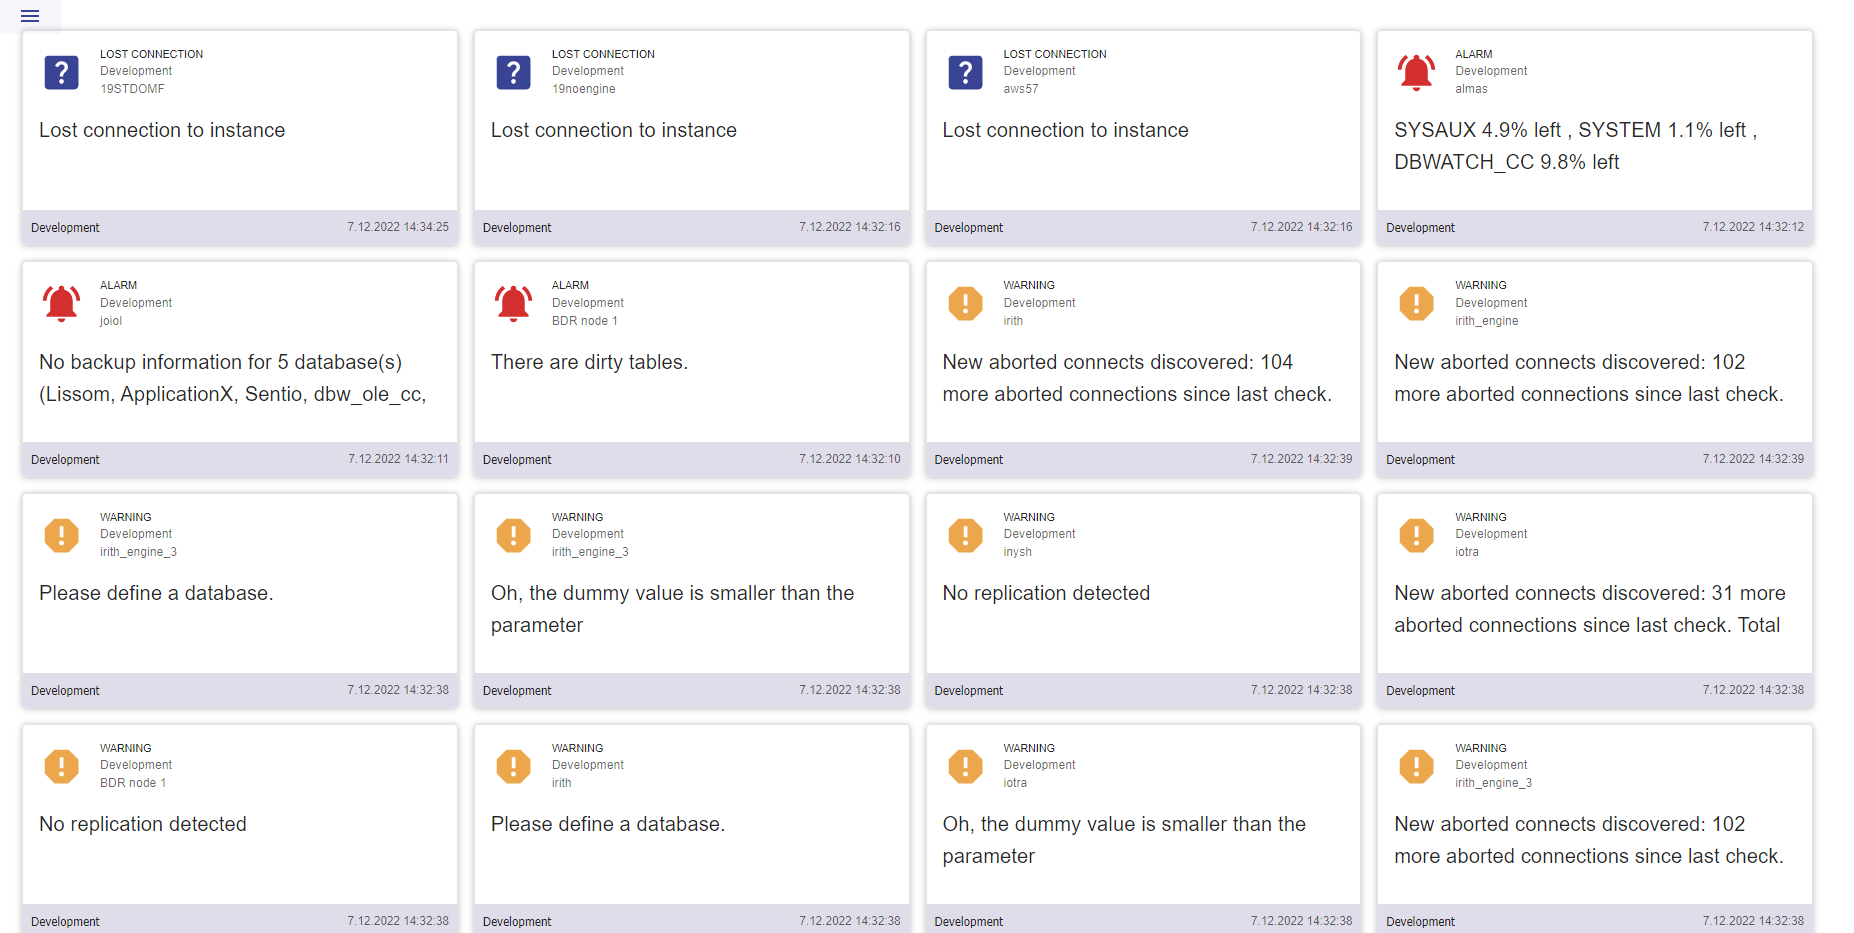
This dashboard visualizes the list of current issues (alarms or warnings from jobs) on all instances on this server.
Job status:
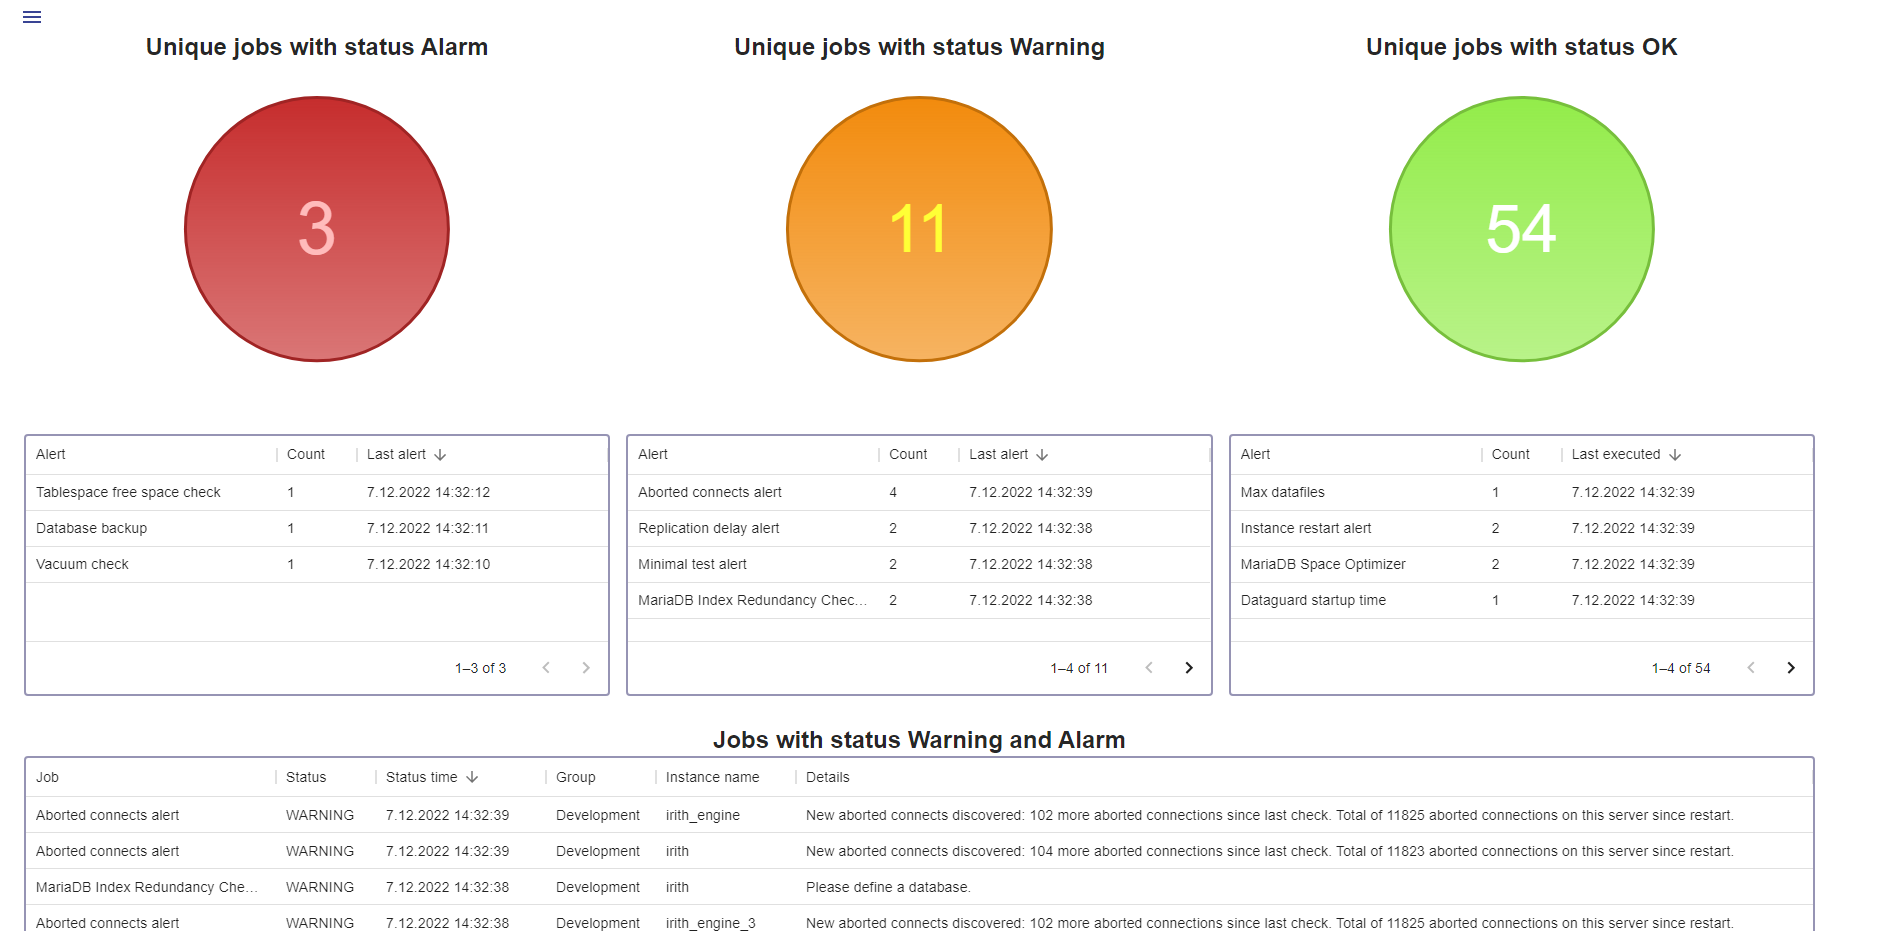
This dashboard visualizes the number of unique jobs in different status on this server.