
Pie chart example
The specification for this chart
<result>
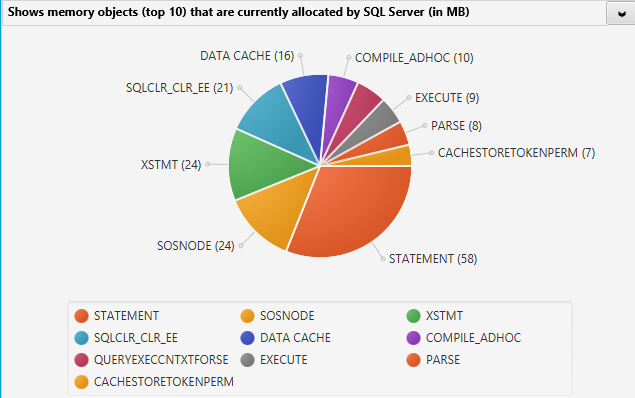
<sql>select top 10 'type' = replace(A.type, 'MEMOBJ_', ''), 'value' = A.value from (
SELECT type, SUM (cast((pages_in_bytes/1024) as int) )/1024 as "value"
from master.sys.dm_os_memory_objects
group by type
union
SELECT
'DATA CACHE', cast(round(count(*)/128.,0) AS int)
FROM sys.dm_os_buffer_descriptors ) A
order by 2 desc
</sql>
<result-type>GRAPHICAL</result-type>
<graphical>
<title>Shows memory objects (top 10) that are currently allocated by SQL Server (in MB)</title>
<resultset>
<column>
<name>type</name>
<sql-type>0</sql-type>
<label/>
</column>
<column>
<name>value</name>
<sql-type>1</sql-type>
<label>MB</label>
</column>
</resultset>
<pie-chart>
<datalabels>type</datalabels>
<to-plot>value</to-plot>
</pie-chart>
</graphical>
</result>
Post your comment on this topic.