Pause
Monitoring in dbWatch have two “levels” of pause. You can pause the monitoring on an instance altogether, meaning that the monitoring jobs will not execute. Or you can pause the alert forwarding, meaning that the jobs will execute but dbWatch will not send any alarms through email or 3 party integrations.
Pause alert forwarding
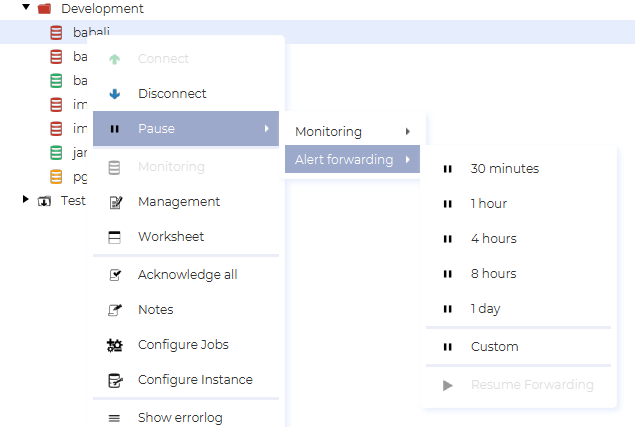
You can pause alert forwarding by right clicking on an instance and selecting the Pause → Alert forwarding menu. Here you can start a pause from now until a predetermind period has passed, or you can create a custom period. If a pause is active, you can end it by selecting Resume forwarding.
Monitoring pause
There are two types of monitoring pauses. A “one time” pause can be started at any time and will last a specified time. A scheduled monitoring pause is a recurring pause scheduled with a crontab style definition.
One time monitoring pause (now)
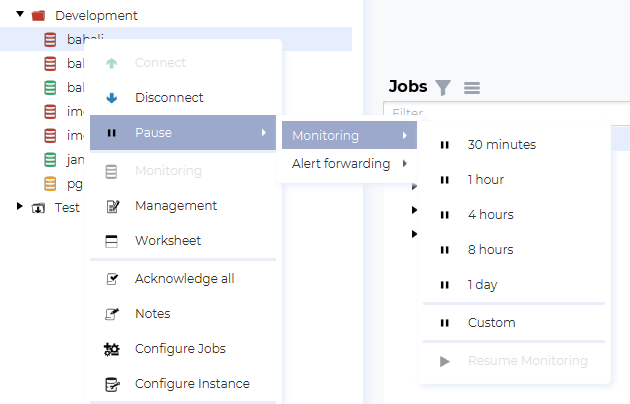
You can pause monitoring now by right clicking on an instance and selecting the Pause → Monitoring menu. This will start a monitoring pause from now and until the selected time has passed. You can stop the pause by selecting Resume monitoring.
Scheduled monitoring pause
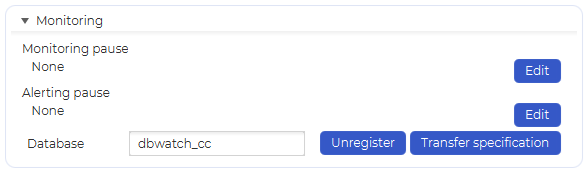
To schedule a monitoring pause, open the instance configuration view and find the Monitoring section under the General tab, then click on “Edit”
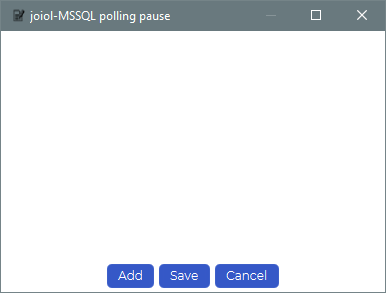
This will open the polling pause list view for the instance. Select “Add”.
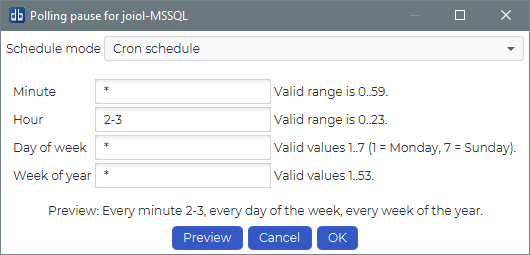
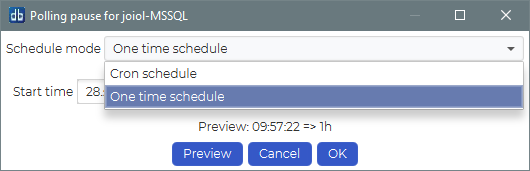
You can choose between scheduling a one time pause or a cron scheduled pause.
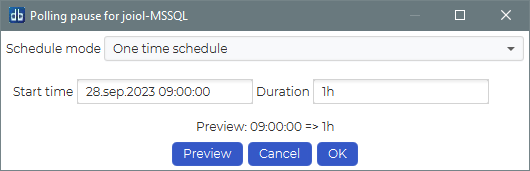
A one time pause is from a specified start time and for a specified duration.
A cron scheduled pause is lets you sepcify a recurring pause. The example below specifies a pause every minute of the hours 2 and 3 (02:00 AM to 03:59 AM), every day of the week, every year.