
When you click on one of the jobs in the job tree, you can see a more detailed job overview.
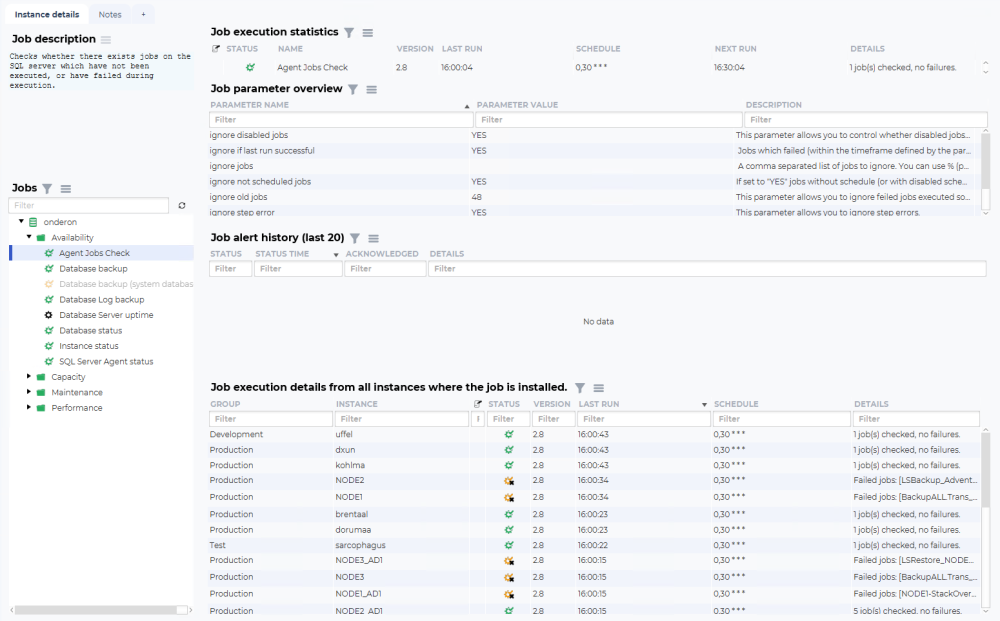
The idea of this overview is to show current and historical state, configured parameters and how the job is behaving on other database instances.
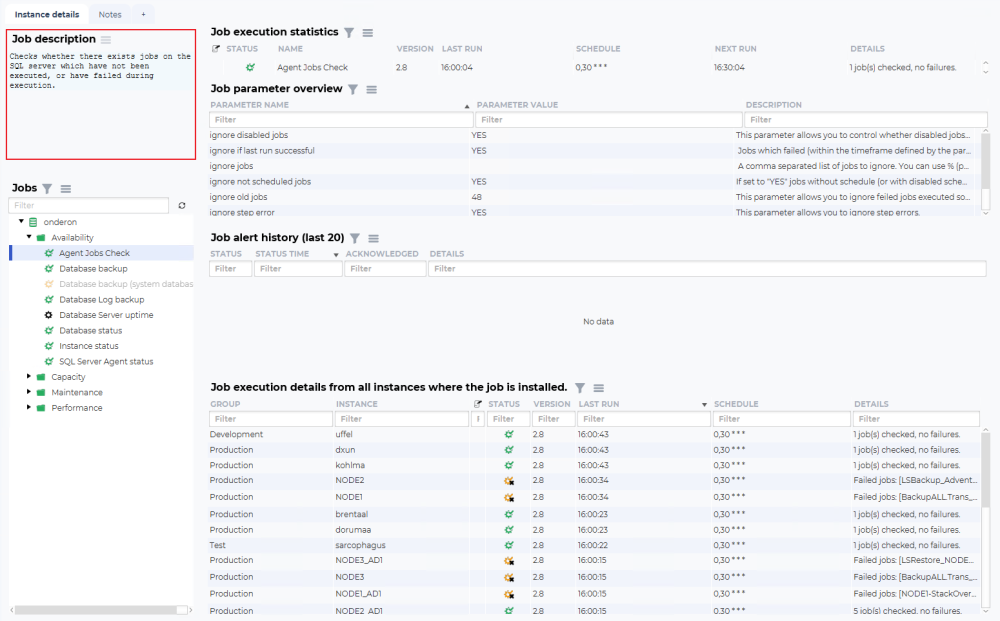
In the top left corner, there is a description of this job and what it does.
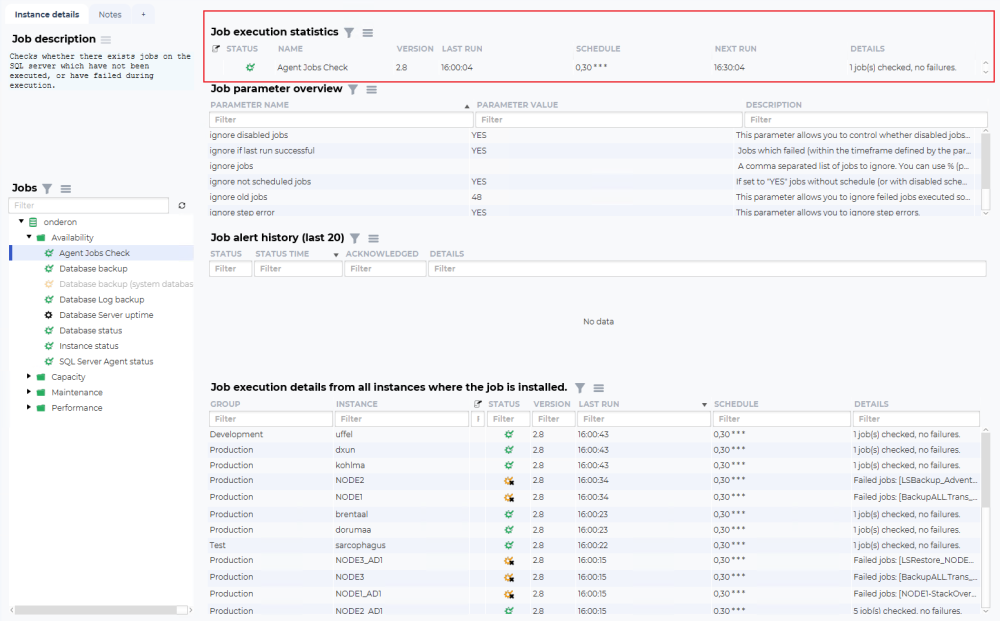
The job execution statistics provide the current status for this job. The fields are “Job note indicator”, “Status”, “Name”, “Version”, “Last run”, “Schedule”, “Next run”, and “Details”.
The “Job note indicator”, will show an icon when someone has created a not on this job on this instance. Notes on jobs are used to store permanent and semi-permanent information about a job on a database instance, such as known issues and problems.
The “Status” icon indicates severity, yellow for warnings, and red for alarms. If there is a black x on the icon, this indicates unacknowledged historical alarms or warnings.
The “Name” is the name of the monitoring job that has found an issue. The jobs are named descriptively so it should be easy to understand what metric they are monitoring.
The “Version” field is the currently running version of this job.
The “Last run” field is the time this job was run last.
The “Schedule” field is the current schedule for this job.
The “Next run” field indicates the next time this monitoring job is scheduled to run.
The “Details” field is used to show an error message regarding the problem detected. More in-depth information is available if you right-click on the issue line, and choose details.
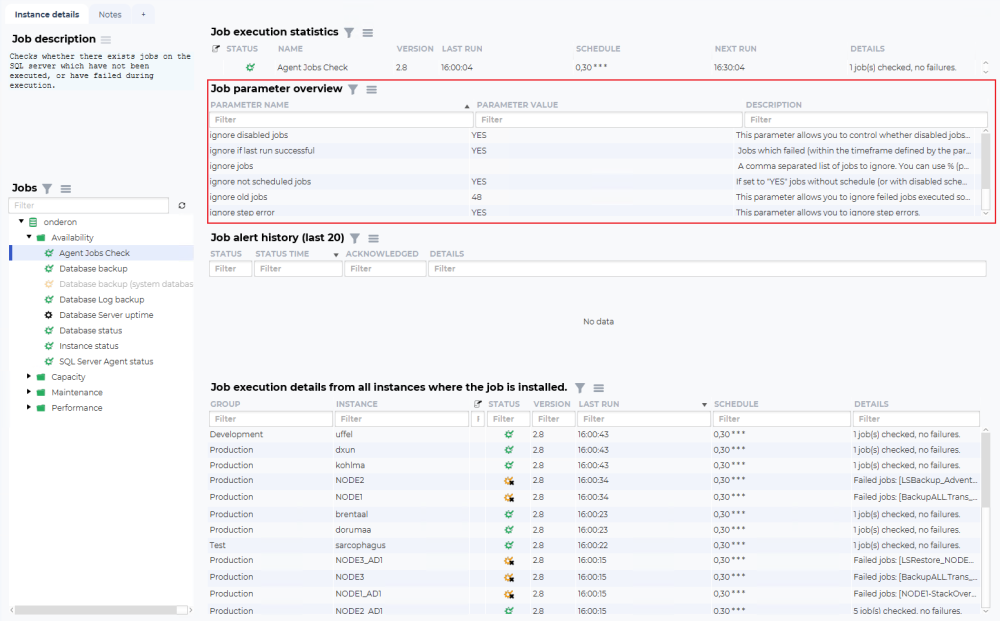
The job parameter overview provides insight into what parameters are configured for this job on this database instance. Each job can have parameters that allow users to control thresholds and behavior of a job to better align with the setup of the database instance and the preferences of the DBA. The fields are “Parameter name”, “Parameter value” and “Description”.
The “Parameter name” field is the descriptive name of the parameter and what it adjusts.
The “Paratemer value” field is the current setting for this parameter.
The “Description” field is the parameter description, that gives the user information about what values are correct for this parameter and what it adjusts.
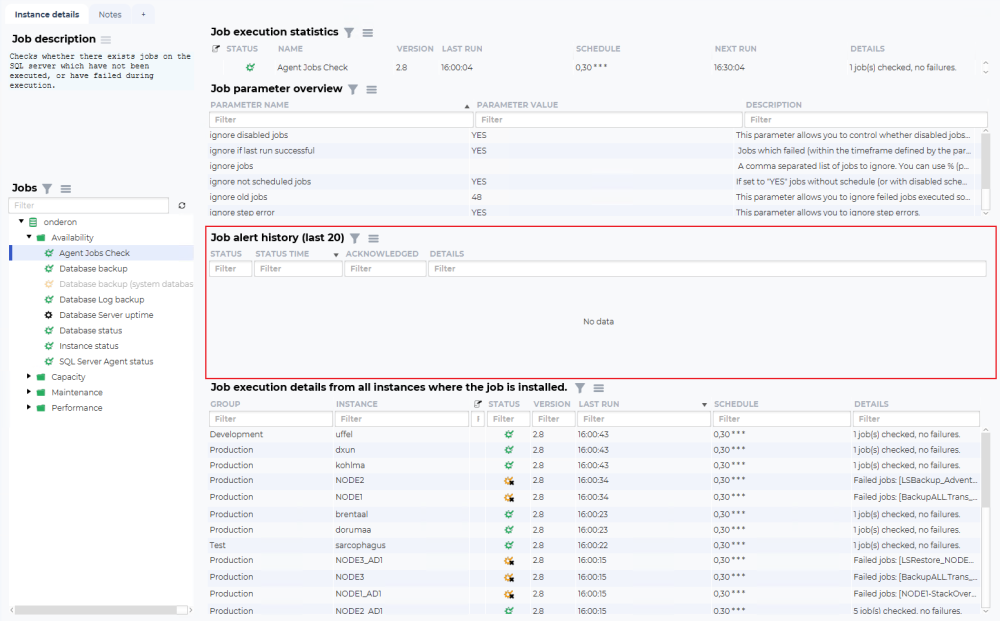
The job alert history (last 20) shows the historical errors this job has had on this instance. It can be empty, as in this example, and show up with “No data”
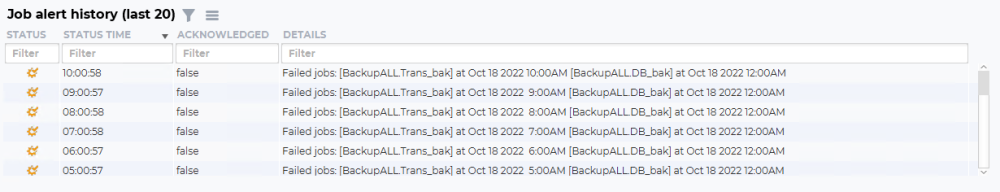
Or contain a long list of alerts generated. This overview has the fields “Status”, “Status time”; “Acknowledged” and “Details”.
The “Status” icon indicates severity, yellow for warnings, and red for alarms.
The “Status time” field shows the time this alert was created.
The “Acknowledged” field shows if this error has been acknowledged not.
The “Details” field is used to show an error message regarding the problem detected.
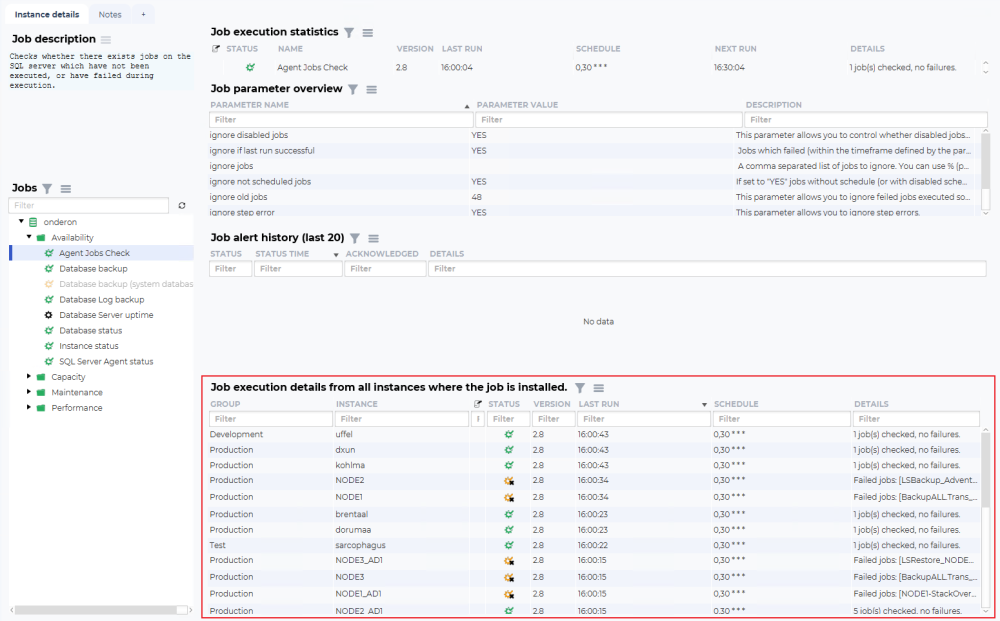
The Job execution details from all instances where the job is installed has a very descriptive name. Its used to see how the same monitoring job is deployed and its status on other database instances.
There are several fields: “Group”, “Instance”, “Job note indicator”, “Status”, “Version”, “Last run”, “Schedule”, and “Details”.
The “Group” field is the instance group for the database instance in the next field.
The “Instance” is the name you have given to the database instance when adding it to dbWatch.
The “Job note indicator”, will show an icon when someone has created a not on this job on this instance. Notes on jobs are used to store permanent and semi-permanent information about a job on a database instance, such as known issues and problems.
The “Status” icon indicates severity, yellow for warnings, and red for alarms. If there is a black x on the icon, this indicates unacknowledged historical alarms or warnings.
The “Version” field is the currently running version of this job.
The “Last run” field is the time this job was run last.
The “Schedule” field is the current schedule for this job.
The “Details” field is used to show an error message regarding the problem detected. More in-depth information is available if you right-click on the issue line, and choose details.
Post your comment on this topic.