Get instance configuration with CCC
Prerequisites
Before you can get instance configuration through CCC you need to go through the steps described in Setting up a CCC node
Getting instance configuration
get_instance.script has the following input parameters:
server – specify server IP and port, by default localhost:7100
domainName – specify domain name, relevant only if the server has multiple domains, if it has only one, it will default to that one.
instanceName – instance name to get configuration for
result – output XML file for configuration, default instance.xml
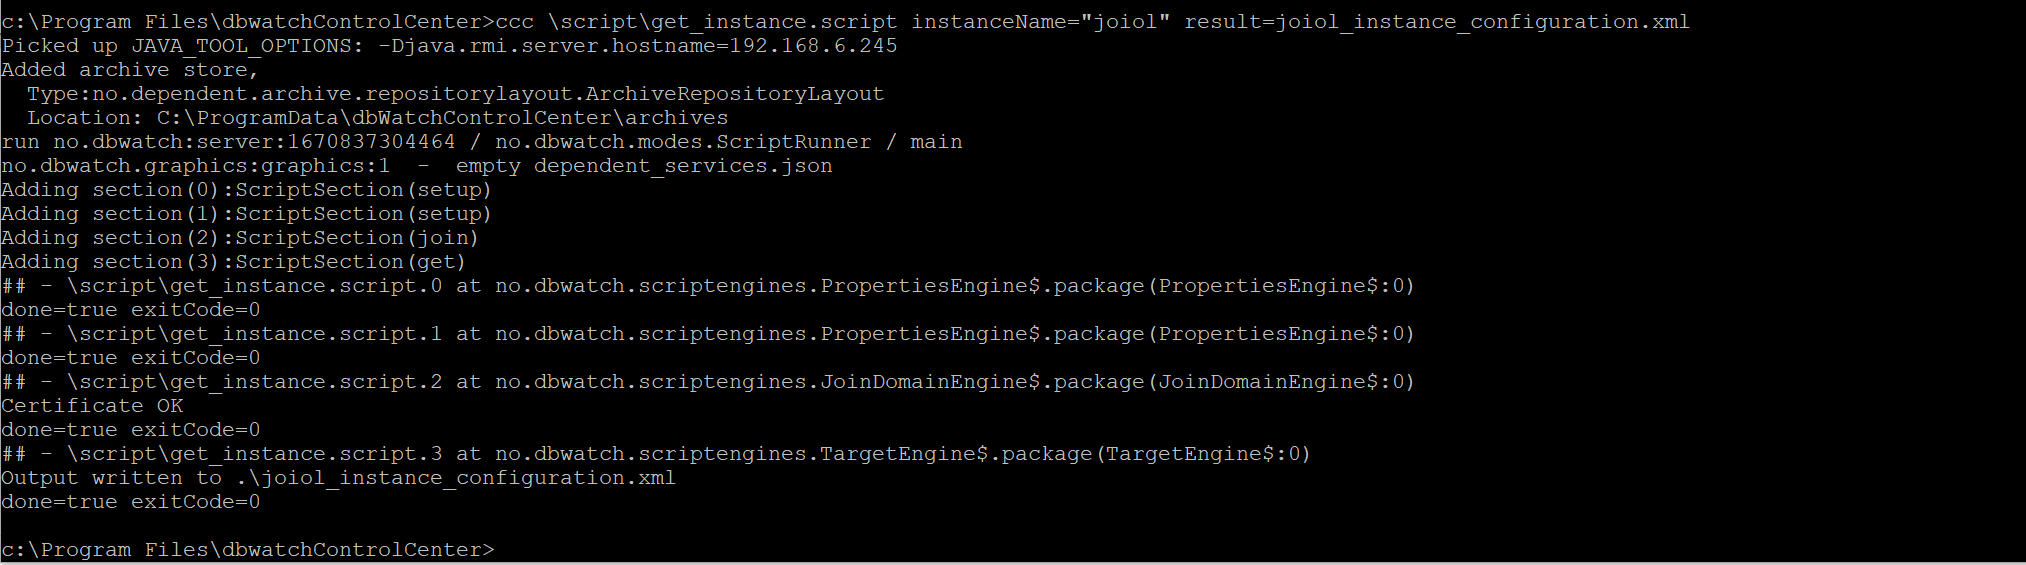
Example:
ccc \script\get_instance.script instanceName=“joiol” result=joiol_instance_configuration.xml