Search
Related topics are listed below.
FDL – Farm Data Language
Advance Topics » FDL – Farm Data Language
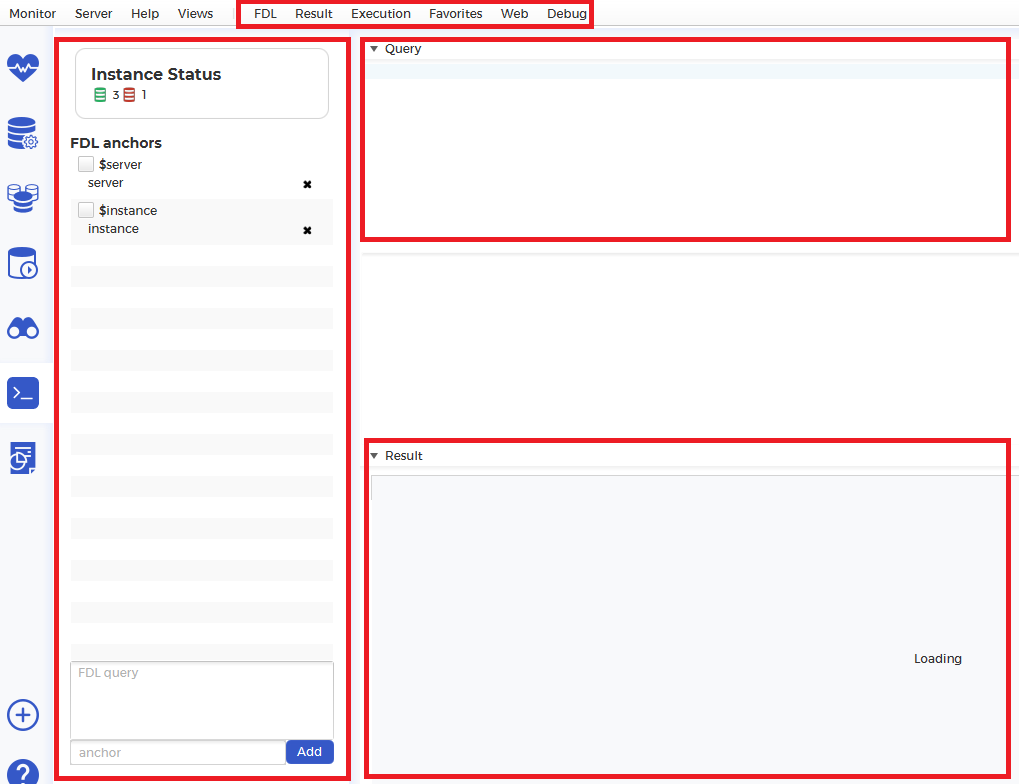
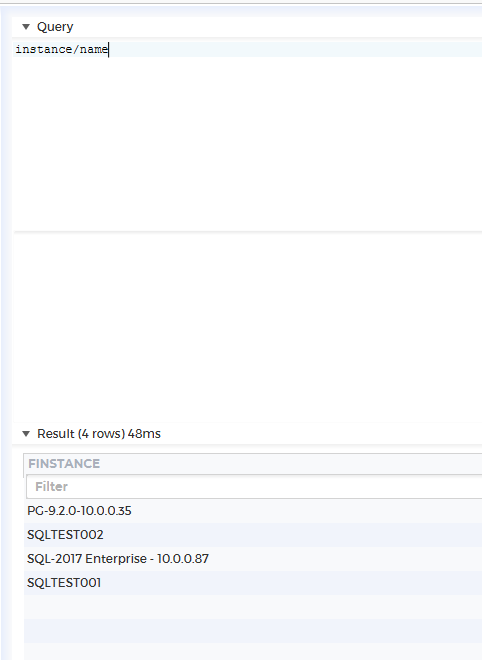
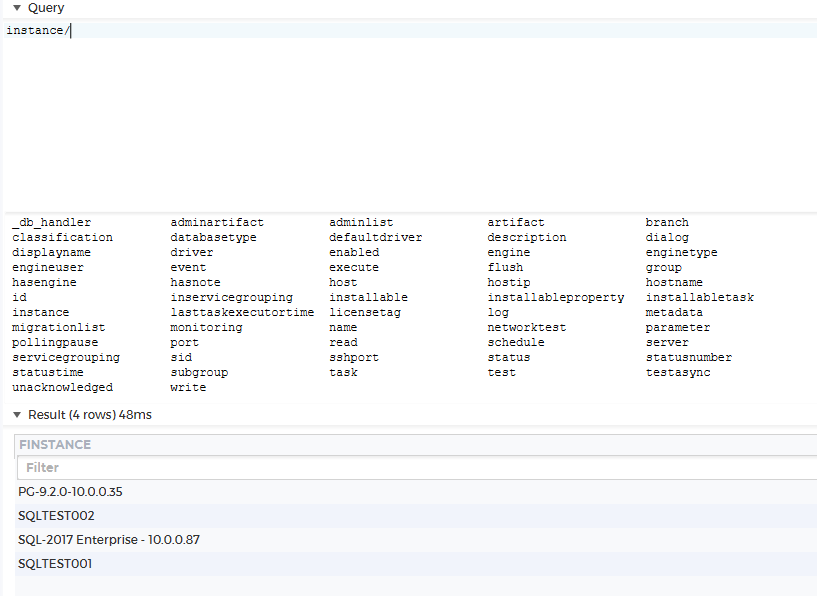
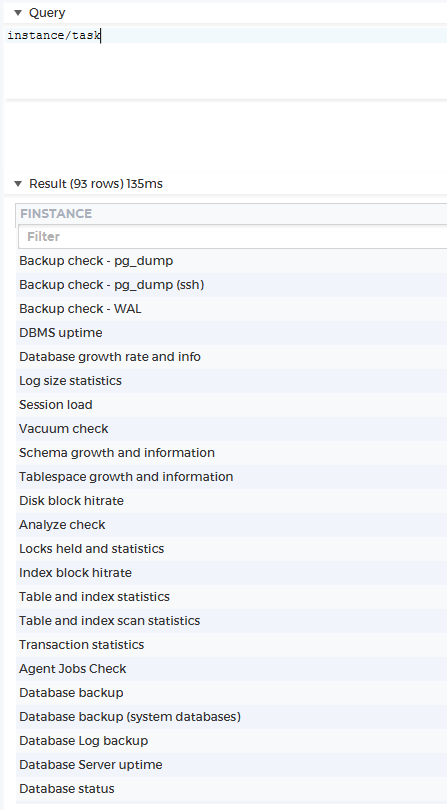
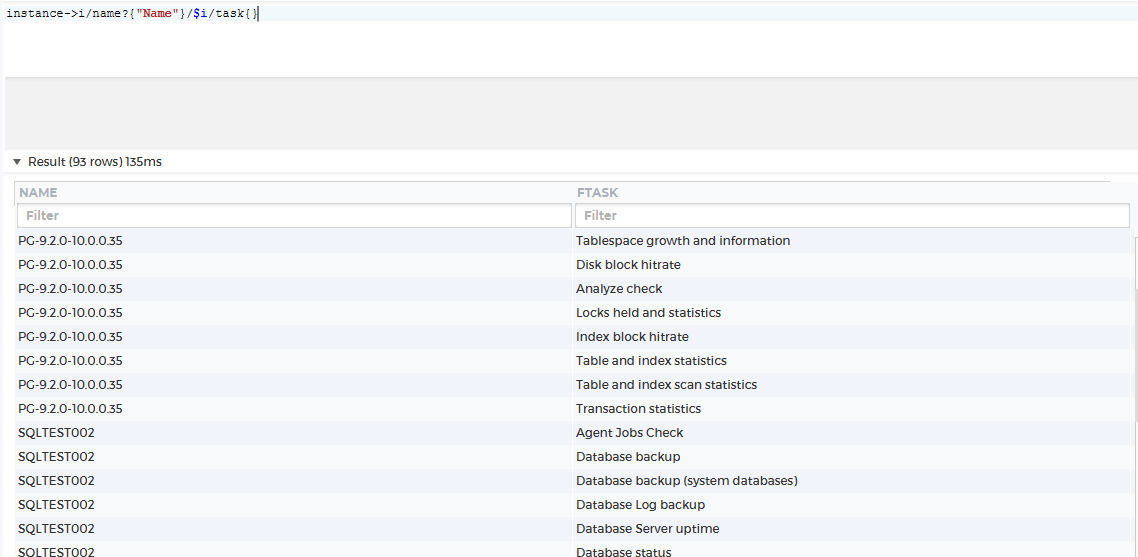
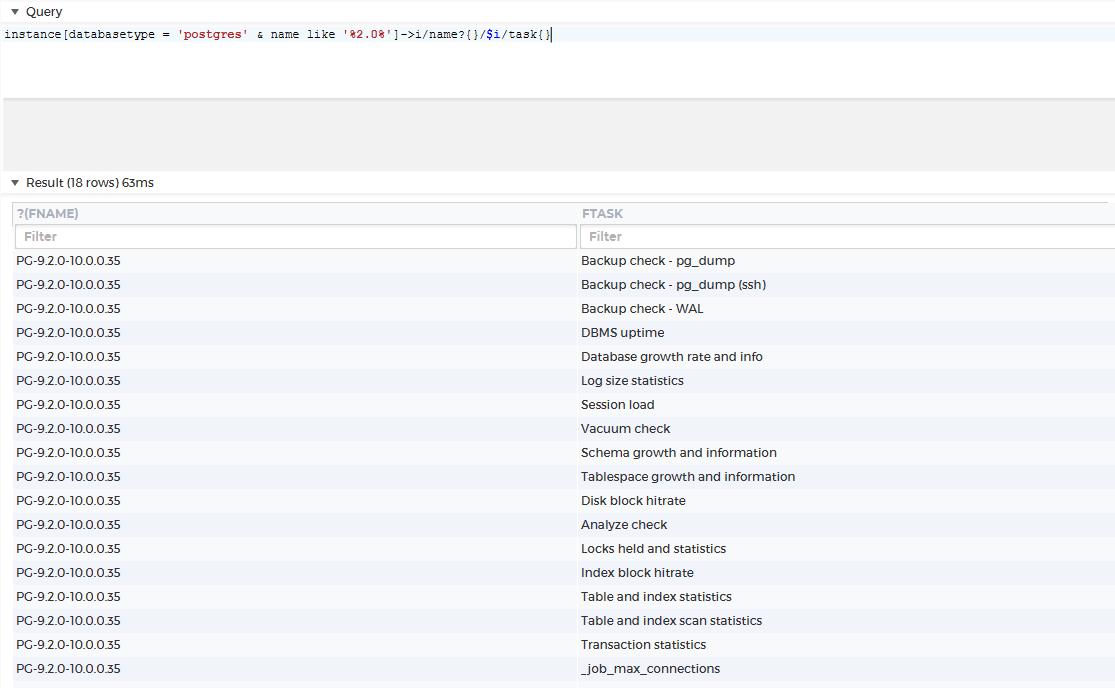
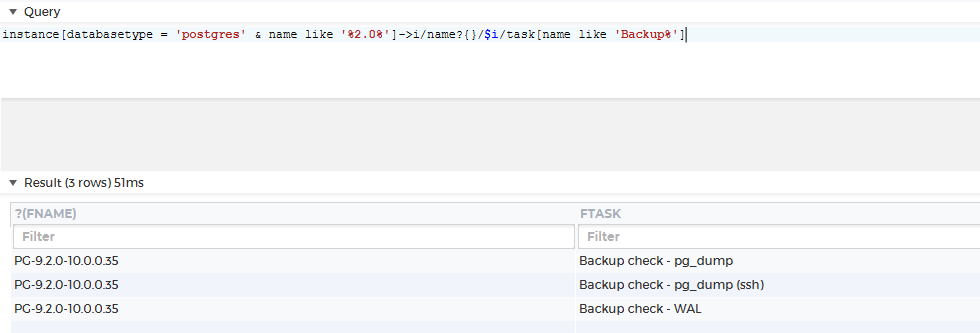
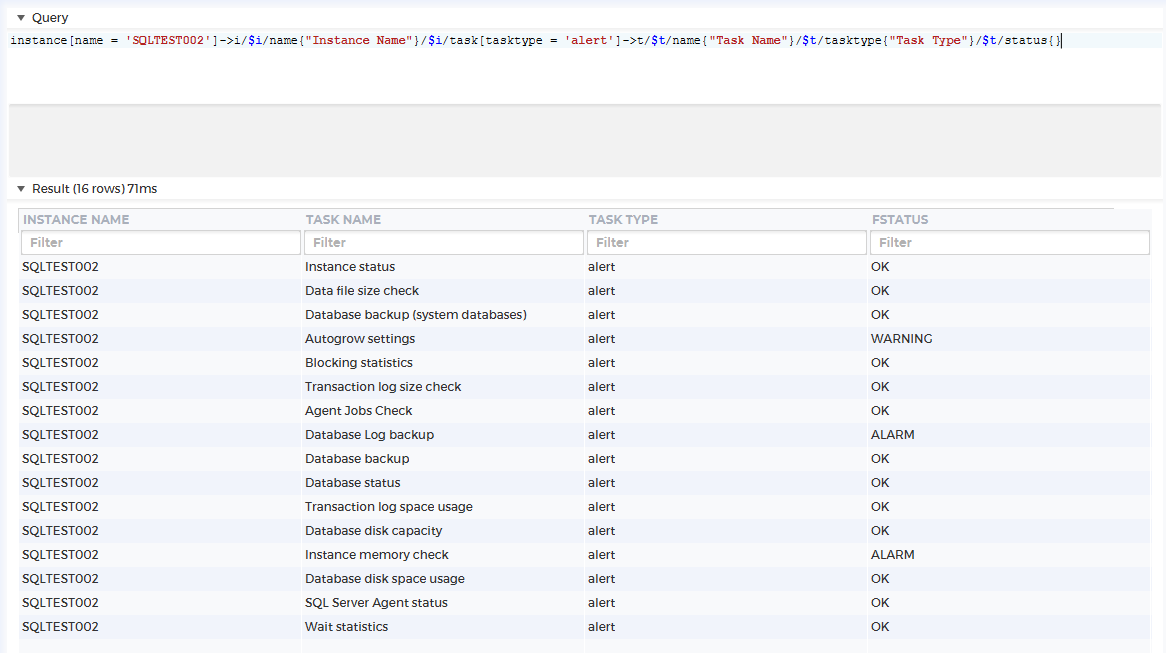
Introduction to Farm Data Language Farm Data Language or FDL for short is the query language used in dbWatch to find information about objects. FDL is formerly known as DBWQL. This topic should be considered as the advanced part of dbWatch. It is also the central…
Modifying dbWatch
Configuration » Modifying dbWatch
Adding custom spring beans to the dbWatch server dbWatch provides some javabased hooks for customizing the behaviour of the dbwatch server. These hooks are injected into the server by the spring framework. Follow these steps to install custom classes into dbWatch…
dbWatch Monitor Setup
This section contains information regarding the setup and usage of the dbWatch monitor. Below are the sub-topics for adding a specific database instance into your Control Center: Microsoft SQL Oracle
Backup of dbWatch
Troubleshooting Guide » Backup of dbWatch
When we think about backup of dbWatch, this involves several different parts of the software and installation: dbWatch Server and configuration files dbWatch Server is installed in a directory which is normally /usr/local/dbWatch/[version] on Unix/Linux and…
Devops with dbWatch
Devops with dbWatch
Database operations and devops Traditionally database operations has been a highly specialized field within it-operations. So much so that many organizations operate with platform specific dba teams. Because of the amount of platform specific know-how needed to…
dbWatch Control Center Navigation
In this chapter, we’ll be looking activities and operations to do in Control Center. ← Groups Configuration / Tree navigation →
About dbWatch Control Center
dbWatch is a highly scalable software solution helping enterprises monitor and manage large numbers of database servers efficiently, providing total control over all aspects of operation, performance and resource usage. dbWatch will give you the total overview you need…
dbWatch monitoring and Reporting
In this section, we’ll be discussing how to modify your monitoring dashboard and generating a report.. ← Category line chart / Monitoring →
Protecting the communication
Configuration » Protecting the communication
This page describes the communication between the dbWatch Monitor and the Server. The default setup To ensure the privacy of the user sessions, dbWatch wraps all communication between the monitors and the servers in ssl. During installation the installer generates…
The FString format
Advance Topics » The FString format
The FString format. FString is a format created to extract data from complex data structures in order to create well-formed files or strings. The basic FString - Any string is considered an FString. - Any parts of the string starting with ‘{$’ and…
The property file format
Advance Topics » Property System » The property file format
Any queriable node in the dbwatch server can have properties. These can be statically set values or dynamically created. This document describes the format used to define dynamic properties. The file header Oracle…
Setting up the default web dashboard
Best Practice for Data Operations » Dashboards and Overview Screens » Setting up the default web dashboard
The web dashboard is the standard monitoring dashboard. Firstly, you will be directed to the first tab which is Instance Status. The Instance Status tab shows an overview of statistics and issues during monitoring. Instances status displayed as visual…
Definition Mapping
Troubleshooting Guide » Definition Mapping
dbWatch 12 dbWatch Control Center Definition Changes Tasks and Alerts Jobs Tasks provide statistics and growth rates for your database, which allows for better planning and performance analysis of how your system is behaving.…
Modify Monitoring View
dbWatch monitoring and Reporting » Monitoring » Modify Monitoring View
On the right side in the Monitoring tab, there are two different views. An instance view and a task view. Wich one depends on the selection in the navigation tree on the left side. Both these views can be modified by right clicking on the header, and selecting…
Control Center Jobs (previously known as Tasks and Alerts)
dbWatch Control Center Navigation » Control Center Jobs (previously known as Tasks and Alerts)
Jobs(older dbWatch versions Tasks and alerts) are the cornerstone of the dbWatch Monitoring module. Jobs perform the actual monitoring of the database instance. There are two types of Monitoring in dbWatch. The Basic and Standard monitoring. Basic Monitoring Basic…
Integrating with Active Directory
Configuration » Integrating with Active Directory
Setting up Active Directory authentication By default dbWatch authenticates users using it’s own internal username/password database. This section describes how to add Active Directory as a second user authentication provider. Connect to the server with the…
Tree navigation
dbWatch Control Center Navigation » Tree navigation
On the left side of the dbWatch monitor, you will see a tree structure. There are 2 component that lets your group and filter instances. Top level of the tree, there is a “Grouping” panel. Below it is a quick text based filter. Grouping This is always…
Advance Topics
Advance Topics
For this section, we’ll be focusing on Farm Data Language and other topics you may find interesting. ← Special setup in NAT environments / FDL – Farm Data Language →
Dynamic properties
Advance Topics » Property System » Dynamic properties
Dynamic properties are defined in xml files located in the [dbWatch Server]/server/resources/properties/ catalog. You cannot add files to this catalogue manually, but import them by placing them in the [dbWatch Server]/server/resources/import_area catalog. Examples…
Configuration
Configuration
Server Configuration The Server Configuration can be accessed through the Server->Server Configuration->Server configuration menu. The configuration values control the following: session-timeout: How long (in seconds) a session (SQL Worksheet) can be inactive…
Edit Jobs
dbWatch Control Center Navigation » Edit Jobs
How to get here Edit Existing To edit an existing Task or Alert open the Task/Alert Editor by right clicking on any task or alert and select Edit task from the popup menu. Create new To create a new Task or Alert from scratch, go to the Manage tasks and alerts…
SQL Worksheet
dbWatch Control Center Navigation » SQL Worksheet
One of the truly unique features of dbWatch is its integrated SQL Worksheet, which, although simple in operation has some sophisticated applications, including cross-database queries. The SQL Worksheet is not developed from a developer-centric perspective and therefore…
Startup configuration
Configuration » Startup configuration
There are two files that supply the startup configuration for dbWatch, both can be found in the root of the dbWatch installation catalog. monitor.conf Startup configuration for the dbWatch Monitor server.conf Startup configuration for the dbWatch…
Running several Monitors in parallel
Advance Topics » Running several Monitors in parallel
In order to run more than one dbWatch Monitor on a machine you have to tell them to use seperate paths for their files. Before making any changes to the files, make sure the the dbWatch Monitor is stopped. The dbWatch Monitor reads a file called monitor.conf on…
Architecture
Best Practice for Data Operations » Architecture
Architecture components The dbWatch installation consists of three components: dbWatch Monitor/Client serves as the front end GUI dbWatch Server is the core business logic and central hub of the system dbWatch Framework contains stored objects in the registered…
Importing resources
dbWatch Control Center Navigation » Importing resources
Much of the functionallity in dbWatch is defined in xml files, including report specifications, task specifictions and management specifications. That means that functionallity can be modified by supplying new xml files to dbWatch. There are two ways of doing…
FAQ
FAQ
In this section – you will find the frequently asked questions regarding the dbWatch. Do you offer an evaluation copy of your product? - Yes, we do offer a 30-day trial for a maximum of 25 database instances of any database platforms supported. We can also…
Installing on Multihomed Systems
Getting Started with Control Center » Installing on Multihomed Systems
Multihomed describes a computer host that has multiple IP addresses connected to networks. When the dbWatch Server runs on a multihomed computer, you have to specify which IP the Server should bind to. On windows Create/change the environment variable called…
Running several Servers in parallel
Advance Topics » Running several Servers in parallel
In order to run more than one dbWatch Server on a machine there are two things you need to do. Make them listen to different ports, and use seperate paths for their files. Before making any changes to the files, make sure the the dbWatch Server is stopped. Change…
Multiserver web dashboards
Best Practice for Data Operations » Dashboards and Overview Screens » Multiserver web dashboards
If you have multiple dbWatch Servers, it is possible to create a dashboard that merges the data from different dbWatch Servers in one view. This can be usefull for large scale dbWatch implementations, Service Providers or customers with database servers in different…
Issues and troubleshooting
Troubleshooting Guide » Issues and troubleshooting
High CPU usage on database Occasionally when investigating resource-consuming SQL statements running on your system, you may find that some of them belong to the dbWatch application. For example, a SQL statement that has the highest value of spent CPU time. In most…
Special setup in NAT environments
Configuration » Special setup in NAT environments
dbWatch 11 and 12 uses JAVA RMI with SSL for network communication, and the JAVA RMI Registry functionality will create a problem when connecting from the monitor client to the server, when the IP address of the actual dbWatch server host is different from the IP…
Licensing terms
Licensing terms
dbWatch End User License Agreement 1. PARTIES This License and Services Agreement (“Agreement”) is between dbWatch AS, organization number 991 500 456 (“dbWatch”) and the Customer which is the entity or person whose name and contact details as it appears on…
Installing on Windows
Getting Started with Control Center » Installing on Windows
dbWatch Server Prerequisites Windows Server (VMWare virtual server supported) 8 GB RAM 4 CPU cores 1 GB HD Space (for dbWatch) dbWatch Engine Prerequisites 100 Mb free space in each database instance. Engine – Server communication determined by each…
Adding a SQL Express Instance
dbWatch Monitor Setup » Adding an SQLServer Instance » Adding a SQL Express Instance
How to get here There are two methods in opening the prompt. First Method: To add a SQLServer instance, click on the “Plus (+)” sign on the bottom left of the dbWatch dashboard. This will bring up the “Add Instance” wizard, which will…
Release notes
About dbWatch Control Center » Release notes
dbWatch Control Center RC 2.0 RC 2.0 is an improvement from RC 1.0 in terms of UI stability and dbWatch server connection. New Features Can support up to 100 databases for now; will keep on expanding to accommodate more Bulk Instance Installation Supports up to…
Fault Finding Guide
Troubleshooting Guide » Fault Finding Guide
Errors before starting the installer The first step is to download the software. Once downloaded, errors may occur when the installer unpacks. The install executable or zip file might have been damaged during download, and if this is indicated, try first downloading…
File Structure
Best Practice for Data Operations » File Structure
Files stored in the users home directory The monitor stores most of it’s configurations in the .dbwatch/monitor/ in the users home directory. This directory contains the following files: monitor.xml Stores various settings and preferences for the…
Restore configuration backup
Troubleshooting Guide » Restore configuration backup
The configuration files in dbWatch are continously backed up using git. Reverting to an old backup Step one If you don’t have git tools installed, you can download them here Step two After stopping the dbWatch Server, use a command prompt (that understands…
Adding an SQLServer Instance
dbWatch Monitor Setup » Adding an SQLServer Instance
How to get here PROMPT SCREEN FOR ADDING INSTANCE There are two methods in opening the prompt. First Method: To add a SQLServer instance, click on the “Plus (+)” sign on the bottom left of the dbWatch dashboard. This will bring up the “Add…
Discovering Database Instances
dbWatch Monitor Setup » Discovering Database Instances
The dbWatch Autodiscover feature scans your network and locates database instances that are available. You will find the Autodiscover feature under the “Autodiscover” tab on the left-most side of the dbWatch Monitor. In the Autodiscover view you have 3…
Monitoring
dbWatch monitoring and Reporting » Monitoring
In this section, we’ll be discussing how to modify your dbWatch dashboard. ← dbWatch monitoring and Reporting / Modify Monitoring View →
Adding an Oracle Instance
dbWatch Monitor Setup » Adding an Oracle Instance
Oracle Prerequisites !1. Oracle databases need to have a listener process running and also allow for an external login with sysdba user or user with enough privileges. 2. You need a privileged user, such as sys as sysdba, another user with sysdba privileges or…
Operator Configuration
dbWatch Monitor Setup » Operator Configuration
Access to dbWatch is controlled through operators. Operators have a password and a set of privileges on dbWatch. How to get here The operator configuration view can be accessed by clicking on Server > Server Configuration > Manage Users and Roles on the main…
Instance Configuration
dbWatch Monitor Setup » Instance Configuration
How to get here Instance Configuration can be accessed by going to Server —> Server Configuration —-> Instance Configuration. Main view The instance configuration view consists of several parts. On the left side you see a tree are the list of your…
Troubleshooting Guide
In this section, we’ll discuss about: dbWatch Backup Restoring Configuration Backup Fault Finding Guide Issues and Troubleshooting Definition Mapping ← Integration for Brent Ozar’s First Responder Kit / Backup of dbWatch…
Property System
Advance Topics » Property System
There are several types of properties in dbWatch. Predefined properties Predefined are always present. For example, instances have properties called name and host. Metadata properties Metadata properties are manually assigned to particular objects in dbWatch (like…
Edit Management
dbWatch Control Center Navigation » Edit Management
Currently there is no graphical interface for editing the managment interface. However, everything is defined in xml files that can be edited directly. Documentation of the syntax is not complete, and you have to rely on the existing code for examples. The following…
Logging
Configuration » Logging
Default setup [Users home]/monitor.log: The monitor will log events to this log. [install dir]/server.log : The server will log events to this log file. Eventlog: On windows systems the server will log login events, failed login events and disconnects to the…
Monitor dashboards and overview screens
Best Practice for Data Operations » Monitor dashboards and overview screens
Being effective in database operations are one of the key focus areas for the dbWatch database operations team. This chapter will focus on the dashboards or overview screens used by our internal database operations team, what information they show, how they are used…
Adding a MySQL Instance
dbWatch Monitor Setup » Adding a MySQL Instance
How to get here To add a MySQL instance, click on the “Add” icon on the main toolbar. This will bring up the “Add Database Instance” wizard, which will guide you through the following steps. Select Installation Type The first step of the…
Bulk installing instances
dbWatch Monitor Setup » Bulk installing instances
Instances can be added in bulk by importing a csv file through the ‘Server’->‘Upload resource’ menu. The CSV file should have the following…
Credential Storage Policy
Configuration » Credential Storage Policy
You can specify the amount of information about logins that the dbWatch Monitor is allowed to store, by adjusting the Server Configuration Setting called monitor-credential-storage-policy. The legal settings are: ALLOW_ALL The Monitor can store the username and…
Defining Autodiscover Ports
dbWatch Monitor Setup » Discovering Database Instances » Defining Autodiscover Ports
By default autodiscover scans the following ports: MS SQL Server: 1433 Oracle: 1520, 1521, 1522, 1523, 1524, 1526, 1527 Sybase: 4998, 4999, 5000, 5001, 5002 MySQL: 3304, 3305, 3306, 3307, 3308 PostgreSQL: 5429, 5430, 5431, 5432, 5433, 5434 You can override the…
Item active
Advance Topics » Item active
You can hide or disable elements (typically nodes or menu items) by using the item-active tag You can specify multiple item-active tags, and all of them have to resolve to “active” in order for the element to be classified as active. The item-active tag…
Notes
dbWatch Control Center Navigation » Notes
dbWatch allows you to attach notes to tasks, instances and servers. You can access the notes dialog by right clicking on a instance/task/server, and selecting “Notes” on the menu. The notes dialog has two tabs, one for public notes (visible to all…
Category line chart
dbWatch Control Center Navigation » Edit Management » Result types » Graphical » Category line chart
A category line chart example The specification for this chart SELECT rtrim(ltrim(instance_name)) "Type", cntr_value "Value" FROM sys.dm_os_performance_counters where counter_name like 'Lock Requests/sec%' and instance_name in ( select top 6…
Formatting table results
dbWatch Control Center Navigation » Edit Management » Formatting table results
When you are displaying a table result based on an SQL query, you have the same render hints that are offered as part of dbwql. To use these hints, add a “result-table-format” tag to the result. select a, b, c from sometable TABLE …
Stacked area chart
dbWatch Control Center Navigation » Edit Management » Result types » Graphical » Stacked area chart
Here is an example of a stacked area chart showing the relationship between active and inactive sessions over time. The specification for this chart: select number_of_processes_active as "Active", number_of_processes_total - number_of_processes_active as…
Integration for Brent Ozar’s First Responder Kit
Advance Topics » Integration for Brent Ozar’s First Responder Kit
In this page you will learn how Control Center integrates Brent Ozar’s First Responder Kit solution, to fine-tune problems within your SQLServer databases. Note: For you to be able to integrate Brent Ozar First Responder Kit, you must have a separate license for…
Groups Configuration
dbWatch Monitor Setup » Groups Configuration
How to get here You can access the group configurations going to Server —> Server Configuration —> Group Configuration. Overview The Group Configuration view consists of two main parts. On the left side you can see a tree structure showing the groups,…
Service groups
dbWatch Control Center Navigation » Service groups
In dbWatch you can organize instances in servicegroups Instances placed in the same servicegroup should provide a common service of some sort. For example this can be instances belonging to the same cluster. Servicegroups may also be placed inside other…
Javascript property
Advance Topics » Javascript property
From dbWatch 12.2.1, one of the engines available in properties is javascript. Example that sums each column from an sql result: scripttest instance[databasetype='sqlserver'] select 1, 2, 3 5s In the javascript code there are…
For SQLServer
dbWatch Control Center Navigation » Control Center Jobs (previously known as Tasks and Alerts) » For SQLServer
Tasks and Alerts Description SQLServer Database alwayson backup Analyzes the backup statistics (type D and I) from the msdb.dbo.backupset table (excluding the system databases: master, model and msdb). Database alwayson…
Database operations philosophy
Best Practice for Data Operations » Database operations philosophy
The reasons for database operations The value of database operations comes from the value of the systems the databases supports. . In a typical operation the value of the managed systems is much greater than the resources used on the operations side. Running a…
Generate Reports
dbWatch monitoring and Reporting » Reporting » Generate Reports
When you click on Report Module, the report wizard will be started. In the first step you will be asked to select the database instance you wish to generate a report for. The instance that does not have a user/login set for generating the report content, will be shown…
JDBC Properties
dbWatch Monitor Setup » Instance Configuration » JDBC Properties
It is possible to set properties for the JDBC driver on specific instances. You can find this under “Advanced Driver Setup” when adding SQL instances or under “Edit parameters” in the JDBC panel in the Configure Instance dialog. The driver…
Graphical
dbWatch Control Center Navigation » Edit Management » Result types » Graphical
The graphical type When specifying the graphical type there must also be a graphical tag inside the result. select ... graphical ... This graphical tag then again contains the various chart specifications. The currently supported charts…
groupby function
Advance Topics » FDL – Farm Data Language » Functions » groupby function
Description Groups a set on some value(s). Used in combination with aggregate function(s). Example Group the instances by database type, and count the number of instances in each…
Result types
dbWatch Control Center Navigation » Edit Management » Result types
You can specift the result type with a “result-type” tag inside the result. select ... table The currently available result types are table / dbwqltable Will display the result as a table. This is the default type. code Will display the…
orderby function
Advance Topics » FDL – Farm Data Language » Functions » orderby function
Description Orders the rows in a set, with an optional limit on the number of rows to return Example Find the 10 instances with the highest number of sessions instance->i{}/total_session_count/orderby('desc', 10) Order the instances based on…
abs function
Advance Topics » FDL – Farm Data Language » Functions » abs function
Description Returns the absolute value of a number Example Find the absolute value for -3 abs(-3) Syntax abs(number) Parameters Type Description Number The number to find the absolute value for
union function
Advance Topics » FDL – Farm Data Language » Functions » union function
The union function finds the union of two sets Description The union function finds the union of two sets Example Find the disk space task from all test instances and disk capacity task from all production instances, and their version union( instance[name like…
Reporting
dbWatch monitoring and Reporting » Reporting
Control Center comes bundled with a series of report templates that you can use to generate standard reports on various aspects of your database environment. It also allows you to edit the templates or create your own for fully customizable reporting which will be…
until function
Advance Topics » FDL – Farm Data Language » Functions » until function
Description Return all numbers from a base number until an end number Example Return the numbers in the range 1 to 5. 1/until(5) Syntax until(number) Parameters Type Description Number The endpoint for the range…
avg function
Advance Topics » FDL – Farm Data Language » Functions » avg function
Description Calculates the average of a set of numbers Example Find the average number of sessions for all your oracle instances avg(instance[databasetype = 'oracle']/total_session_count) avg(instance[databasetype = 'oracle']/total_session_count,…
For Oracle
dbWatch Control Center Navigation » Control Center Jobs (previously known as Tasks and Alerts) » For Oracle
Tasks and Alerts Description Oracle Alert log check This check reads and looks for errors in the database alert log. Uses embedded java to read files. Alert log check 11g This check reads and looks for errors in…
intersect function
Advance Topics » FDL – Farm Data Language » Functions » intersect function
The intersect function finds the values that are in both set A and set B Description Finds the intersection of two sets Example Find tasks from the ‘sla_higs_tasks’ list that are installed on instances tagged with sla=low intersect( …
Functions
Advance Topics » FDL – Farm Data Language » Functions
Functions in dbwql Numeric functions Function name Description add Adds a number to a base value sub Substracts a number from a base value div Diveds a number mult Multiplies a number…
sub function
Advance Topics » FDL – Farm Data Language » Functions » sub function
Description Substracts a number from a base value. Example Find the port number below the current port number for an instance instance[name = 'A']/port/sub(1) Syntax sub(number) Parameters Type Description Number The number…
min function
Advance Topics » FDL – Farm Data Language » Functions » min function
Description Finds the minvalue from a set, or from a number of values. Example Find the minnumber of sessions for all your oracle instances min(instance[databasetype = 'oracle']/total_session_count) Returns the smallest of the arguments (average…
add function
Advance Topics » FDL – Farm Data Language » Functions » add function
Description Adds a number to a base value. Example Find the port number above the current port number for an instance instance[name = 'A']/port/add(1) Syntax add(number) Parameters Type Description Number The number to add…
max function
Advance Topics » FDL – Farm Data Language » Functions » max function
Description Finds the max value from a set, or from a number of values. Example Find the max number of sessions for all your oracle instances max(instance[databasetype = 'oracle']/total_session_count) Returns the largest of the arguments (average…
round function
Advance Topics » FDL – Farm Data Language » Functions » round function
The round function rounds a number to a specified precision Description Rounds a number Example Find tasks from the ‘sla_higs_tasks’ list that are installed on instances tagged with sla=low instance/disk_space/round(2) round(instance/disk_space,…
Line chart
dbWatch Control Center Navigation » Edit Management » Result types » Graphical » Line chart
A line chart example The specification for this chart: select (SELECT cntr_value FROM sys.dm_os_performance_counters where counter_name = 'Index Searches/sec') as "Index Scans", (SELECT cntr_value FROM sys.dm_os_performance_counters where…
sum function
Advance Topics » FDL – Farm Data Language » Functions » sum function
Description Sums the numbers in a set Example Find the total number of sessions for all your oracle instances sum(instance[databasetype = 'oracle']/total_session_count) Syntax sum(expression) Parameters Type Description Expresssion…
count function
Advance Topics » FDL – Farm Data Language » Functions » count function
Description Counts the number of rows in a set Example Find the number of instances with status warning. count(instance[status='WARNING']) Syntax count(expression) Parameters Type Description Expression An expression that…
mkstring function
Advance Topics » FDL – Farm Data Language » Functions » mkstring function
The mkstring function makes a string from a set of values Description Creates a string from a set of values Example Make a comma separated string of all instance names mkstring(instance/displayname, ", ") Syntax mkstring(expression) mkstring(expression,…
distinct function
Advance Topics » FDL – Farm Data Language » Functions » distinct function
Description Removes duplicates from a set of values Example Get the set of versions for all instances distinct(instance/version) instance/distinct(version)
Getting Started with Control Center
Proceed to the next page to install Control Center in Windows. ← Multiserver web dashboards / Installing on Windows →
concat function
Advance Topics » FDL – Farm Data Language » Functions » concat function
Description Concats a number of strings Example Get all hosts and append the domain “.dbwatch.com” instance/concat(host, '.dbwatch.com') Syntax concat(string1, string2, …)
Best Practice for Data Operations
In this Chapter we will be looking at the following: Architecture File Structure Database Operations Philosophy Monitor Dashboards and Overview Screens Dashboards and Overview Screens ← Release notes / Architecture →
Dashboards and Overview Screens
Best Practice for Data Operations » Dashboards and Overview Screens
In this section, we will be focusing on how to set-up your dashboard and setting it up with multiple servers. ← Monitor dashboards and overview screens / Setting up the default web dashboard →
div function
Advance Topics » FDL – Farm Data Language » Functions » div function
Description Diveds a number Example Divide the number of instances by 7 count(instance)/div(7) div(count(instance), 7) Syntax expression1/div(expression2) div(expression1, expression2) Parameters Type Description Expression1 …
mult function
Advance Topics » FDL – Farm Data Language » Functions » mult function
Description Multiples a number Example Multiply the number of instances by 2 count(instance)/mult(2) mult(count(instance), 2) Syntax expression1/mult(expression2) mult(expression1, expression2) Parameters Type Description Expression1 …
trim function
Advance Topics » FDL – Farm Data Language » Functions » trim function
Description Strips empty spaces from the beginning and end of a string Example Get all hosts without leading or trailing spaces instance/host/trim() instance/trim(host) Syntax trim(expression) value/trim() Parameters Type Description …
Pie chart
dbWatch Control Center Navigation » Edit Management » Result types » Graphical » Pie chart
Pie chart example The specification for this chart select top 10 'type' = replace(A.type, 'MEMOBJ_', ''), 'value' = A.value from ( SELECT type, SUM (cast((pages_in_bytes/1024) as int) )/1024 as "value" from…
Category chart
dbWatch Control Center Navigation » Edit Management » Result types » Graphical » Category chart
A catagory chart example The specification for this chart GRAPHICAL SELECT top 10 case when len(DB.name) > 30 then substring(DB.name,1,30)+'_DBID_' +cast(DB.database_id as varchar(4)) +' (alias)' else DB.name end AS "Database…