The topic you requested could not be found.
Related topics are listed below.

Upgrade dbWatch

Using Control Center » Domain Configuration » Upgrade dbWatch

If you have dbWatch version 2023-06-27 or later, it is possible to semi automatically upgrade the dbWatch Servers. *Only available for Windows Servers. For linux, look here. In the Domain Configuration dialog, select the Upgrade tab. Click on the Check button to…

dbWatch alerts

Using Control Center » Management » Management on SQL Server » dbWatch alerts

dbWatch alerts is a list of monitoring jobs in the database in warning or alarm state for this database instance. Example: This is handy so you know you are working on the right database instance when you are correcting issues. You can interact with the…

Backup of dbWatch

Troubleshooting Guide » Backup of dbWatch

When we think about backup of dbWatch, this involves several different parts of the software and installation: dbWatch Server and configuration files dbWatch Server places its configuration files and workarea in “C:\ProgramData\dbWatchControlCenter\” by…

dbWatch engine alert

Using Control Center » Monitoring » Control Center Jobs » Jobs grouped by platform » Jobs for MS SQL Server » dbWatch engine alert

Name: dbWatch engine alert Platform: Sqlserver Category: Internal Internal Description: This procedure gathers statistics per database. Long description: This alert returns warning/alarm if there are several…

dbWatch engine alert

Using Control Center » Monitoring » Control Center Jobs » Jobs grouped by platform » Jobs for PostgreSQL » dbWatch engine alert

Name: dbWatch engine alert Platform: Postgres Category: Internal Description: Collects database uptime statistics. Long description: Version: 1 Default schedule: 15m Requires…

Query cache hitrate

Using Control Center » Monitoring » Control Center Jobs » Jobs grouped by platform » Jobs for MySQL » Query cache hitrate

Name: Query cache hitrate Platform: Mysql Category: Performance Description: Shows the query cache hit rate Long description: Task shows the hit rate of query cache Version: 2.42 Default…

Cached query statistics

Using Control Center » Monitoring » Control Center Jobs » Jobs grouped by platform » Jobs for MS SQL Server » Cached query statistics

Name: Cached query statistics Platform: Sqlserver Category: Performance Description: This task returns aggregate performance statistics based on cached query plans in SQL Server. Long description: This task…

Query store status

Using Control Center » Monitoring » Control Center Jobs » Jobs grouped by platform » Jobs for MS SQL Server » Query store status

Name: Query Store status Platform: Sqlserver Category: Capacity Description: Checks Query Store space usage in every database where it is enabled. Long description: Checks Query Store space usage in every…

Query cache hitrate

Using Control Center » Monitoring » Control Center Jobs » Jobs grouped by platform » Jobs for MariaDB » Query cache hitrate

Name: Query cache hitrate Platform: Mariadb Category: Performance Description: Shows the query cache hit rate Long description: Task shows the hit rate of query cache Version: 2.42 Default…

dbWatch Server activity alert

Using Control Center » Monitoring » Control Center Jobs » Jobs grouped by platform » Jobs for MS SQL Server » dbWatch Server activity alert

Name: dbWatch Server activity alert Platform: Sqlserver Category: Internal Internal Description: This procedure gathers statistics per database. Long description: This alert returns warning/alarm if the dbWatch…

Properties on dbWatch Servers

Advanced Topics » FDL – Farm Data Language » Available properties » Properties on dbWatch Servers

The available properties for server are: Name Description Return type Typical values Extra name, displayname The name of the dbWatch Server Entity dbWatch Control Center instance All the instances…

About dbWatch Control Center

About dbWatch Control Center

dbWatch Control Center is a highly scalable software solution that helps enterprises monitor and manage large database servers efficiently, providing total control over all database operations, performance, and resource usage. dbWatch Control Center will give you the…

Query cache hitrate (old)

Using Control Center » Monitoring » Control Center Jobs » Jobs grouped by platform » Jobs for MariaDB » Query cache hitrate (old)

Name: Query cache hitrate Platform: Mariadb Category: Performance Description: Shows the query cache hit rate Long description: Task shows the hit rate of query cache Version: 2.42 Default…

Fresh Installation of dbWatch Control Center

Troubleshooting Guide » Fresh Installation of dbWatch Control Center

After installing a newer version of dbWatch Control Center, you may encounter problems such as an expired license or a locked account due to forgetting the admin credentials. Here’s a simple guide on doing a fresh installation of dbWatch Control Center.…

Resetting dbWatch Control Center Admin Account

Troubleshooting Guide » Resetting dbWatch Control Center Admin Account

Before resetting your admin account, you must be familiar with your working directory. By default, dbWatch Control Center will create a directory in C:\ProgramData\dbWatchControlCenter .If you are not sure, you can open the dbWatch Logo or go to Help > About dbWatch.…

Supported Web Browsers for dbWatch Dashboard

Customization » Web server » Supported Web Browsers for dbWatch Dashboard

As of the current version, dbWatch Dashboard supports the following web browsers: Google Chrome Microsoft Edge Firefox Why These Browsers? Our focus on Google Chrome and Microsoft Edge is driven by several factors: Advanced Features and Standards These…

The FString format

Advanced Topics » The FString format

The FString format. FString is a format created to extract data from complex data structures in order to create well-formed files or strings. The basic FString - Any string is considered an FString. - Any parts of the string starting with ‘{$’ and…

The property file format

Customization » Property System » The property file format

Any queriable node in the dbwatch server can have properties. These can be statically set values or dynamically created. This document describes the format used to define dynamic properties. The file header Oracle…

The modules of Control Center

Using Control Center » The modules of Control Center

We have seven default modules available when you start dbWatch Control Center. This article will only introduce you to what these instances are and give a brief description of them. You need to be familiar with the navigation tree to better understand how these modules…

Installation of the Security and Compliance package

Installing and using premium packages » Security and Compliance package » Installation of the Security and Compliance package

Installation of the Security and Compliance package The Security and Compliance package is a premium package that comes with extra cost. If you want to get this package and its not part of your current license, please contact sales@dbwatch.com. To install the…

Control Center Commandline

Advanced Topics » Control Center Commandline

CCC.exe – the Control Center Commandline CCC.exe is a command intended to run on the commandline or terminal to trigger USL scripts. The intention of CCC is to use it for integration and automation purposes to access the capabilities of dbWatch for other 3rd…

Formatting table results

Customization » Management » Formatting table results

When you are displaying a table result based on an SQL query, you have the same render hints that are offered as part of dbwql. To use these hints, add a “result-table-format” tag to the result. select a, b, c from sometable TABLE …

Advanced Topics

Advanced Topics

For this section, we’ll be focusing on Farm Data Language and other topics you may find interesting. ← Anonymous webaccess / FDL – Farm Data Language →

Item active

Customization » Management » Item active

You can hide or disable elements (typically nodes or menu items) by using the item-active tag You can specify multiple item-active tags, and all of them have to resolve to “active” in order for the element to be classified as active. The item-active tag…

Customize View using FDL

Customization » Monitoring » Customize View using FDL

Before proceeding to this section, you must be familiar with Farm Data Language. To give you an overview, Farm Data Language is a type of query dbWatch uses to read and display data to its user. Think of it as your query tool when using dbWatch. How to edit…

Property System

Customization » Property System

There are several types of properties in dbWatch. Predefined properties Predefined properties are always present. For example, instances have properties called name and host. For more details see available properties Metadata properties Metadata properties are…

Dynamic properties

Customization » Property System » Dynamic properties

Dynamic properties are defined in xml files located in the [dbWatch Server]/server/resources/properties/ catalog. You cannot add files to this catalogue manually, but import them by placing them in the [dbWatch Server]/server/resources/import_area catalog. Examples…

Properties

Customization » Monitoring » Editor for engine jobs » Properties

The properties section defines the main settings for the job. Once a job is created the “Task name”, “Company” and “Compatibility” is specified. “Task name” is the visible job name when you install a job or when its…

Stacked area chart

Customization » Management » Result types » Graphical » Stacked area chart

Here is an example of a stacked area chart showing the relationship between active and inactive sessions over time. The specification for this chart: select number_of_processes_active as "Active", number_of_processes_total - number_of_processes_active as…

Customization

Customization

dbWatch Control Center is designed to be customizable and much of the contents are developed inside the product In this section, we will go over how you can customize different parts of the product. To proceed, click on of the topics below: Customize dbWatch Views…

Definition Mapping

Troubleshooting Guide » Definition Mapping

dbWatch 12 dbWatch Control Center Definition Changes Tasks and Alerts Jobs Tasks provide statistics and growth rates for your database, which allows for better planning and performance analysis of how your system is behaving.…

No-engine jobs

Customization » Monitoring » No-engine jobs

No-engine jobs No-engine jobs are monitoring jobs that does not run in the database engine. No-engine jobs are jobs that run on the dbWatch Server, and typically run a SQL statement and process the result of this statement in javascript. Example code for different…

Email and SMS

Customization » Extensions and 3rd party integrations » Email and SMS

Configure In the dbWatch Monitor, go to the “Server”->”Server Extensions” menu. An item called “E-mail extension” should now be visible. To configure the extension, select it and click “Configure”. You should now see the initial configuration screen…

FDL – Farm Data Language

Advanced Topics » FDL – Farm Data Language

Introduction to Farm Data Language Farm Data Language or FDL for short is the query language used in dbWatch to find information about objects. FDL is formerly known as DBWQL. This topic should be considered as the advanced part of dbWatch. It is also the central…

Performance

Using Control Center » Monitoring » Control Center Jobs » Jobs grouped by category » Performance

Jobs in the Performance category Control Center Jobs Description Oracle Blocking detector Checks if a session is waiting on a TX (transaction) lock. Buffer cache statistics Gets data cache statistics for buffer cache in…

Jobs for MariaDB

Using Control Center » Monitoring » Control Center Jobs » Jobs grouped by platform » Jobs for MariaDB

Control Center Jobs Description Availability DBMS uptime Collects uptime statistics in the database. Aborted connects alert Collects uptime statistics in the database. Maximum connections alert Collects uptime…

Jobs for MySQL

Using Control Center » Monitoring » Control Center Jobs » Jobs grouped by platform » Jobs for MySQL

Control Center Jobs Description Availability DBMS uptime Collects uptime statistics in the database. MySQL aborted connects Checking if there is many aborted connects MySQL max connections Checking if the system…

Tree navigation

Using Control Center » Monitoring » Tree navigation

On the left side of the dbWatch monitor, you will see a tree structure. There are 2 component that lets your group and filter instances. Top level of the tree, there is a “Grouping” panel. Below it is a quick text based filter. Grouping This is always…

Integration with SSMS

Installing and using premium packages » SQL Performance package » Using SQL Performance package on SQL Server » Integration with SSMS

When analyzing a SQL statement, the choice “Show query plan (using SSMS)” appears on SQL Server. This is for opening a query plan in SQL Server Management Studio. Clicking on this will not open anything, if it is not setup correctly. There is a monitor.xml…

FDL with CCC

Advanced Topics » Control Center Commandline » FDL with CCC

Prerequisites Before running fdl through CCC you need to go through the steps described in Setting up a CCC node First we need to specify the fdl query to execute. This is done by editing the “fdl.script” file. The query is specified after the query?=…

Adding MySQL Instance with Super Privilege Error

Troubleshooting Guide » Adding MySQL Instance with Super Privilege Error

MySQL Super Privilege Error When adding an instance for MySQL 5.0 or over, you may encounter the following error: This error happens when dbWatch Control Center is creating a user. This error appears indicating that the user has no super privilege rights. There…

Sensitive Data Transmitted

Advanced Topics » Product Security » Sensitive Data Transmitted

Sensitive Data Transmitted dbWatch Control Center will, by its nature log into database instances and run queries on the database instances it manages. Key data accessed is primarily data related to statistics on the behavior of the database instance, and not actual…

Automated maintenance package

Installing and using premium packages » Automated maintenance package

Automated Maintenance Package The Automated Maintenance Package is an additional package for dbWatch Control Center, designed to streamline routine database maintenance tasks. By automating essential upkeep, this package helps ensure optimal database performance and…

Metadata properties

Customization » Property System » Metadata properties

You can put metadata on instances, and this metadata will be automatically available in FDL. To add metadata to an instance, right click on it and select “Configure”. Then click on the “Metadata” tab. Here you can add key/value pairs by…

Web data export

Customization » Web server » Web data export

You can export data from dbWatch through http for easy access by others (tools or humans). Data can be made available formatted as json or csv. Data export might require anonymous webaccess configured. Any data formatted as a table in the dashboard will support data…

Windows BUILTIN groups

Using Control Center » Monitoring » Control Center Jobs » Jobs grouped by platform » Jobs for MS SQL Server » Windows BUILTIN groups

Name: Windows BUILTIN groups Platform: Sqlserver Category: Security Premium package: Security and compliance package Description: Checks that Windows BUILTIN groups are not SQL Logins. Long…

Jobs for MS SQL Server

Using Control Center » Monitoring » Control Center Jobs » Jobs grouped by platform » Jobs for MS SQL Server

Control Center Jobs Description Agresso (part of Agresso Application Package) Agresso report queue Monitors and checks pending or running reports. Returns warning or alarm if the elapsed time exceeds defined…

Worksheet

Using Control Center » Worksheet

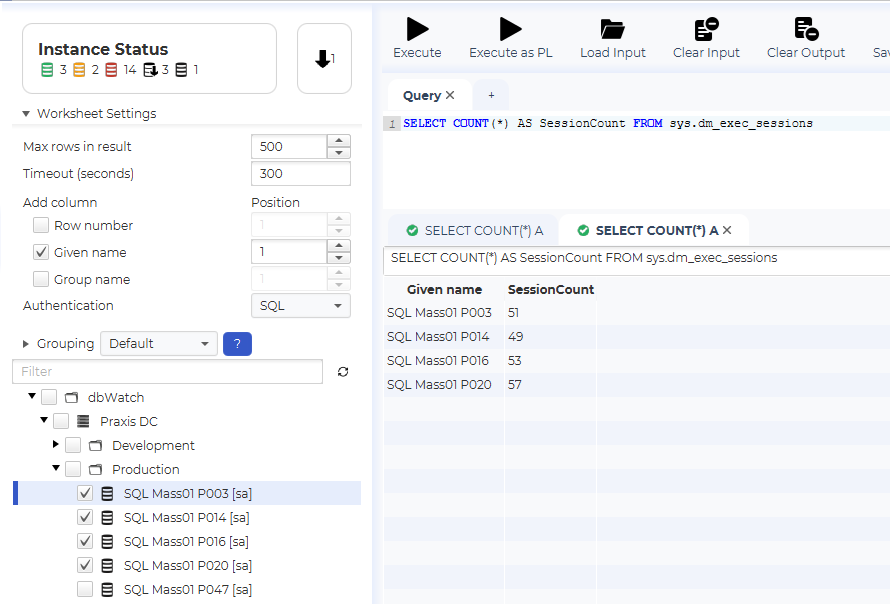
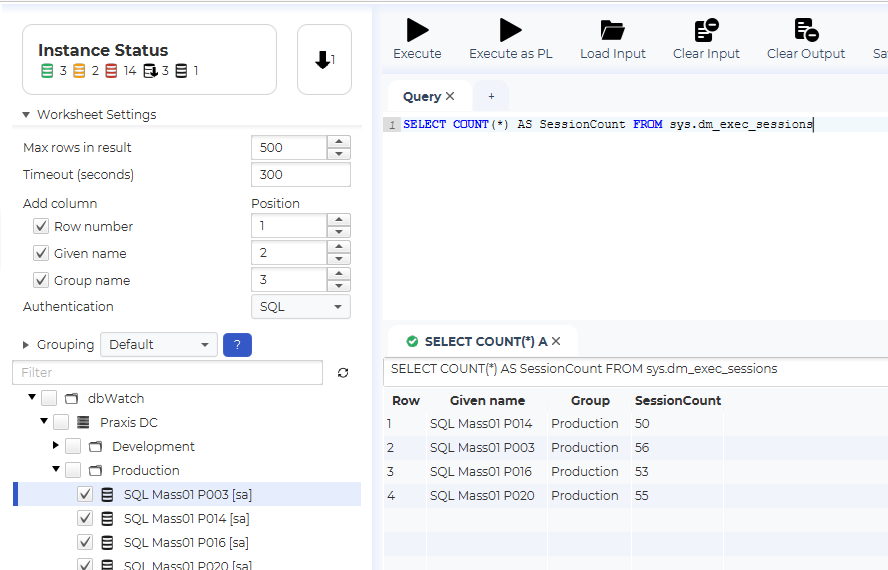
One of the truly unique features of dbWatch is its integrated SQL Worksheet, which, although easy to use has sophisticated applications, including cross-database queries. The SQL Worksheet is meant to give responsible DBA’s the ability to locate any problems and…

Edit Report Templates

Using Control Center » Reporting » Edit Report Templates

Report Selection When you click on Server -> “Reporting” on the toolbar and then select “Edit Report Template”, you will see a list of all available report templates. Select the report template you wish to edit and click “OK”.…

Release notes

About dbWatch Control Center » Release notes

dbWatch Control Center (2024-11-26) Download New features DBW – Bulk setting of SQL Worksheet authentications DBW – SQL Worksheet query timeout parameter DBW – AD integration now handles LDAP Signing DBW – CCC can now connect to non DC…

Properties on Instances

Advanced Topics » FDL – Farm Data Language » Available properties » Properties on Instances

Instances are available under server through the instance property server/instance All instances have the following properties: Name Description Return type Typical values Extra name The given name of the instance String…

Report

Customization » Monitoring » Editor for engine jobs » Report

The report section of a job is a lightweight version of the reporting engine in Control Center. It supports SQL queries that can be used in multiple output formats, such as graphs and tables. You can right-click on the “Report” item, add new…

Using SQL Performance package on Oracle

Installing and using premium packages » SQL Performance package » Using SQL Performance package on Oracle

Navigating to the SQL Performance package dashboard Once the SQL statistics job is installed and have collected data, you can navigate to the dashboard. It is located in the management interface for that database instance. The pictures and descriptions are from…

Repository management and monitoring

Installing and using premium packages » SQL Performance package » Repository management and monitoring

Introduction The SQL Performance package creates tables in the dbWatch schema/database on each database instance where the SQL Statistics job is installed and scheduled. The process combines two parts of dbWatch Control Center. The monitoring is used to schedule the…

Using SQL Performance package on SQL Server

Installing and using premium packages » SQL Performance package » Using SQL Performance package on SQL Server

Navigating to the SQL Performance package dashboard Once the SQL statistics job is installed and have collected data, you can navigate to the dashboard. It is located in the management interface for that database instance. The pictures and descriptions are from SQL…

Find your version

About dbWatch Control Center » Find your version

Checking dbWatch Version To check your current dbWatch version, you can: 1. See it in the upper portion of your application. 2. Open Help > About dbWatch or click on the dbWatch Icon: You’ll see a window showing you the current version of dbWatch Control…

Maintenance

Using Control Center » Monitoring » Control Center Jobs » Jobs grouped by category » Maintenance

Jobs in the Maintenance category Control Center Jobs Description Oracle Framework Engine framework is used when upgrading earlier versions of dbWatch. Ensures the dbWatch Engine and dbWatch Server run compatible…

Management on SQL Server

Using Control Center » Management » Management on SQL Server

When opening the management module in its initial state, you get the status dashboard: This will give an overview of the system, displaying some instance information, the largest databases, logical reads, session load, and memory usage. When a graph indicates…

Network and communications

Product Overview » Network and communications

Network and communications Default ports and protocol dbWatch Control Center uses by default port 7100/tcp for client to node and node to node connections. This can be configured to a different port. On each node there is a node.connections file that both lists what…

Architecture

Product Overview » Architecture

Architecture components The dbWatch installation consists of three components: dbWatch Monitor/Client serves as the front-end GUI dbWatch Server is the core business logic and central hub of the system dbWatch Framework contains stored objects in the registered…

Product Security

Advanced Topics » Product Security

Introduction on dbWatch Control Center regarding product security dbWatch AS has implemented reasonable administrative, technical and physical safeguards to help protect against security incidents and privacy breaches involving a dbWatch product, provided those…

Getting Started

Getting Started

Downloading the latest version of Control Center You can get a download link to the latest version of dbWatch Control Center by registering for a free evaluation copy Wait for dbWatch’s Confirmation Email. Follow the steps and link in that email. There are…

Functions

Advanced Topics » FDL – Farm Data Language » Functions

Functions in FDL Numeric functions Function name Description add Adds a number to a base value sub Substracts a number from a base value div Diveds a number mult Multiplies a number …

Jobs for PostgreSQL

Using Control Center » Monitoring » Control Center Jobs » Jobs grouped by platform » Jobs for PostgreSQL

Control Center Jobs Description Availability Backup check – pg_dump Checks that there exists an up to date backup file. Backup check – WAL Checks that the WAL files have been backed up. DBMS…

Jobs for Oracle

Using Control Center » Monitoring » Control Center Jobs » Jobs grouped by platform » Jobs for Oracle

Control Center Jobs Description Agresso (part of the Agresso Application Package) Agresso reports queue Monitors and checks pending or running reports. Returns warning or alarm if the elapsed time exceeds defined…

Availability

Using Control Center » Monitoring » Control Center Jobs » Jobs grouped by category » Availability

Jobs in the Availability category Control Center Jobs Description Oracle Alert log check This check reads and looks for errors in the database alert log. Alert log check This check reads and looks for errors in the database…

Jobs for Sybase

Using Control Center » Monitoring » Control Center Jobs » Jobs grouped by platform » Jobs for Sybase

Control Center Jobs Description Availability Database backup Checks backup status of all databases. Database status Checks status of all databases defined on the system. The following incidents triggers a warning or an…

Licensing terms

Licensing terms

dbWatch End User License Agreement 1. PARTIES This License and Services Agreement (“Agreement”) is between dbWatch AS, organization number 991 500 456 Norway (“dbWatch”), and the Customer, which is the entity or person whose name and contact details as it…

Importing resources

Customization » Importing resources

Much of the functionallity in dbWatch is defined in xml files, including report specifications, task specifictions and management specifications. That means that functionallity can be modified by supplying new xml files to dbWatch. There are two ways of doing…

Console installation on Ubuntu

Getting Started » Installing on Linux » Console installation on Ubuntu

Before You Start Before installing the dbWatch Control Center, note that the installer requires root privileges. For simplicity, this documentation demonstrates steps executed as the root user. You may use ‘sudo’ as an alternative. This guide is for…

Example architecture designs

Product Overview » Architecture » Example architecture designs

Basic setup The most basic setup is where a dbWatch Server service is configured with all functions in the same node, and the client is either local or installed on a separate computer. Example drawing: The pictured architecture is similar to the design and setup…

Capacity

Using Control Center » Monitoring » Control Center Jobs » Jobs grouped by category » Capacity

Jobs in the Capacity category Control Center Jobs Description Oracle ASM disk statistics Checks ASM disks for status and statistics. ASM diskgroup space Checks ASM diskgroups space statistics. Monitor SYS.AUD$…

Installing on Windows

Getting Started » Installing on Windows

dbWatch Server Prerequisites Windows Server (VMWare virtual server or AWS EC2 supported) Windows Server 2008, 2012, 2016, 2019, and 2022 Windows 10 or Windows 11 8 GB RAM 4 CPU cores 10 GB hard drive space dbWatch Engine Prerequisites 500 Mb free space in…

Editor for engine jobs

Customization » Monitoring » Editor for engine jobs

How to get here Example jobs We have some example jobs to make the development easier here. Edit Existing To edit an existing Task or Alert open the Task/Alert Editor by right clicking on any task or alert and select Edit task from the popup menu. Create new…

Privileges and actions map

Using Control Center » Domain Configuration » Privileges and actions map

Overview of actions and required privilege Instance is the specific database instance. Instance system is a predefined security group controlling the overall instance monitoring and management. Domain configuration is a predefined security group controlling the…

Auditing

Advanced Topics » Auditing

DbWatch supports auditing of all statements that are executed on the database instances from dbWatch. There is currently no graphical way of turning this feature on, so it involves manually editing the server_configuration.xml file. Stop the dbWatch Server and take a…

Job types

Using Control Center » Monitoring » Job concepts » Job types

There are currently two types of jobs, engine jobs, and no-engine jobs. The main difference between them is where processing occurs. Engine jobs do the processing in the database instance engine, and no-engine jobs do the processing on the Control Center Instance…

Report

Using Control Center » Monitoring » Job concepts » Report

Each job has a job report that is generated when you use the job menu and choose “Details”. The job report, here an example from the CPU load details on Oracle, provides a set of graphs, pie charts, and tables. It uses previously generated history…

Cluster and replication

Using Control Center » Monitoring » Control Center Jobs » Jobs grouped by category » Cluster and replication

Jobs in the Cluster and replication category Control Center Jobs Description Oracle Blocking detector for RAC Checks if a session is waiting on a TX (transaction) lock. (RAC only) Memory session load for RAC Records the…

Control Center Jobs

Using Control Center » Monitoring » Control Center Jobs

Jobs (older dbWatch versions Tasks and alerts) are the cornerstone of the dbWatch Monitoring module. Jobs perform the actual monitoring of the database instance. There are two types of Monitoring in dbWatch. The Basic and Standard monitoring. To see each monitoring…

Initial Domain Setup

Getting Started » Initial Domain Setup

All dbWatch Servers are part of a domain. This domain is unique for each customer and it is specified in the dbWatch license. Every dbWatch installation must have one of the dbWatch Servers specified as the Domain Controller. The first time a you start the dbWatch…

Framework

Using Control Center » Monitoring » Control Center Jobs » Jobs grouped by platform » Jobs for Oracle » Framework

Name: Framework Platform: Oracle Category: Maintenance Maintenance Description: Engine framework is used when upgrading earlier versions of dbWatch. Ensures the dbWatch Engine and dbWatch Server run compatible…

Monitoring

Customization » Monitoring

Custom monitoring and editing monitoring jobs dbWatch has two types of monitoring jobs that can detect issues in the database instances. They are referred to as Engine jobs and “No-engine jobs”. Engine jobs are jobs that run inside the database engine,…

Installing and using premium packages

Installing and using premium packages

Premium packages dbWatch Control Center also provides additional premium packages to cover specific areas. They may be specific only to one or a few of the platforms supported by dbWatch Control Center. More details are found on the pages specific to the package.…

Application Modules

Advanced Topics » Application Modules

About application modules The dbWatch framework is easy to extend and expand with tasks, alerts, reporting and administration to support specific applications. An application module is a bundle of tasks, alerts, reports and administration xml files to allow dbWatch to…

Jobs grouped by platform

Using Control Center » Monitoring » Control Center Jobs » Jobs grouped by platform

Go to the individual platforms to see the jobs for that database platform Jobs for Oracle Jobs for MS SQLServer Jobs for MySQL Jobs for MariaDB Jobs for PostgreSQL Jobs for Sybase ← Control Center Jobs / Jobs for Oracle →

Web server

Customization » Web server

Control Center can be configured to serve dynamic web content over http. This is intended for dashboards or live reports, and for data export used for integration purposes. Webserver configuration Webserver setup Configuring anonymous webaccess Mountable web…

Graphical installation on Ubuntu

Before you start The installer for dbWatch Control Center requires root to run. However, when we want to run the software under a different user once installed. I will run all the first steps as user root for documentation simplicity. You can use sudo instead. This…

Using Control Center

Using Control Center

In this section, we will cover the user interface, the different modules, and how they are used. When we start dbWatch Control Center we will by default start-up in the monitoring view: We have the top menu, where we find the configuration of client connections…

Job concepts

Using Control Center » Monitoring » Job concepts

This section will try to explain more in-depth some of the concepts used in monitoring jobs in Control Center. There are currently two types of jobs, engine jobs, and no-engine jobs. The main difference between them is where processing occurs. Engine jobs do the…

Instance management

Using Control Center » Instance management

In instance management we focus on the process of adding, removing and managing instances and instance groups. You will need to add database instances to dbWatch Control Center in order to monitor, manage and create reports from your database instances. There are 4…

Engine jobs

Using Control Center » Monitoring » Job concepts » Job types » Engine jobs

Engine jobs Each engine Job consists of a set of objects (procedures, tables, etc) that are installed on the monitored database instance. The main procedure will be triggered by the dbWatch Server, This procedure will then perform a check or collect statistics…

Jobs grouped by category

Using Control Center » Monitoring » Control Center Jobs » Jobs grouped by category

Jobs by category Jobs in Control Center are grouped by category to make it easier for users to locate the right monitoring job. The categories are: Availability Jobs that checks that the database and database related processes are functioning Capacity – Jobs…

Job menus

Using Control Center » Monitoring » Job menus

Each job has a set of menus. They can be accessed if you right-click on a job. This gives you several options. “Run now” will trigger the job now, outside of the normal schedule. “Details” will open the job report, providing details about…

File Structure

Product Overview » File Structure

Files stored in the users home directory The dbWatch Monitor stores files in the “.dbwatch/.monitor/” catalog in the users home directory. This directory contains the following directories: config Config files crypto Cryptographic keys data Currently…

Unit4 Agresso

Advanced Topics » Application Modules » Unit4 Agresso

Installation guide for Microsoft SQL Server and Oracle platforms The dbWatch Agresso Module is based on the dbWatch Engine Framework and can be installed during the initial installation of the dbWatch Framework. If the MS SQL Server or Oracle instance where the…

Using SQL Performance package on MySQL

Installing and using premium packages » SQL Performance package » Using SQL Performance package on MySQL

Navigating to the SQL Performance package dashboard Once the SQL statistics job is installed and have collected data, you can navigate to the dashboard. It is located in the management interface for that database instance. The pictures and descriptions are from…

Product Overview

Product Overview

Product Overview In Product Overview, we will look into architecture and structure and give an overview of how the application operates. Chapters: Architecture File Structure Network and communications Database Operations Philosophy Monitor Dashboards and…

Adding SQLServer instances with kerberos

Using Control Center » Instance management » Adding a SQLServer Instance » Adding SQLServer instances with kerberos

Using the kerberos authentication option requires some additional setup. We need dbwatch user added to the domain: First we create a dbwatch user that is a normal domain user. We set a passord, and make sure it dont expire. And we must add this user to the…

Exporting configuration from 12 to CC

Advanced Topics » Exporting configuration from 12 to CC

Exporting database instance configuration from dbWatch 12 to CC A version of 12.9.1 or above is needed for this. The idea is that you can export the instance configuration from a dbWatch 12.9.x installation to install the same instances in dbWatch Control Center, as…