
Introduction to Farm Data Language
Farm Data Language or FDL for short is the query language used in dbWatch to find information about objects. FDL is formerly known as DBWQL.
This topic should be considered as the advanced part of dbWatch. It is also the central part from which many features in dbWatch are based and should be learned by anyone who wants to get the most out of their dbWatch installation.
FDL highlights
- FDL uses path expressions to navigate the dbWatch state.
- FDL uses filter expressions to filter a set of data.
- FDL is modeled on the XPath language.
- FDL is designed to fetch data asynchronously to efficiently fetch data from multiple servers.
Introduction
The best way to get familiar with FDL is by using the FDL console, accessible as a tab on the left side of the dbWatch Monitor.
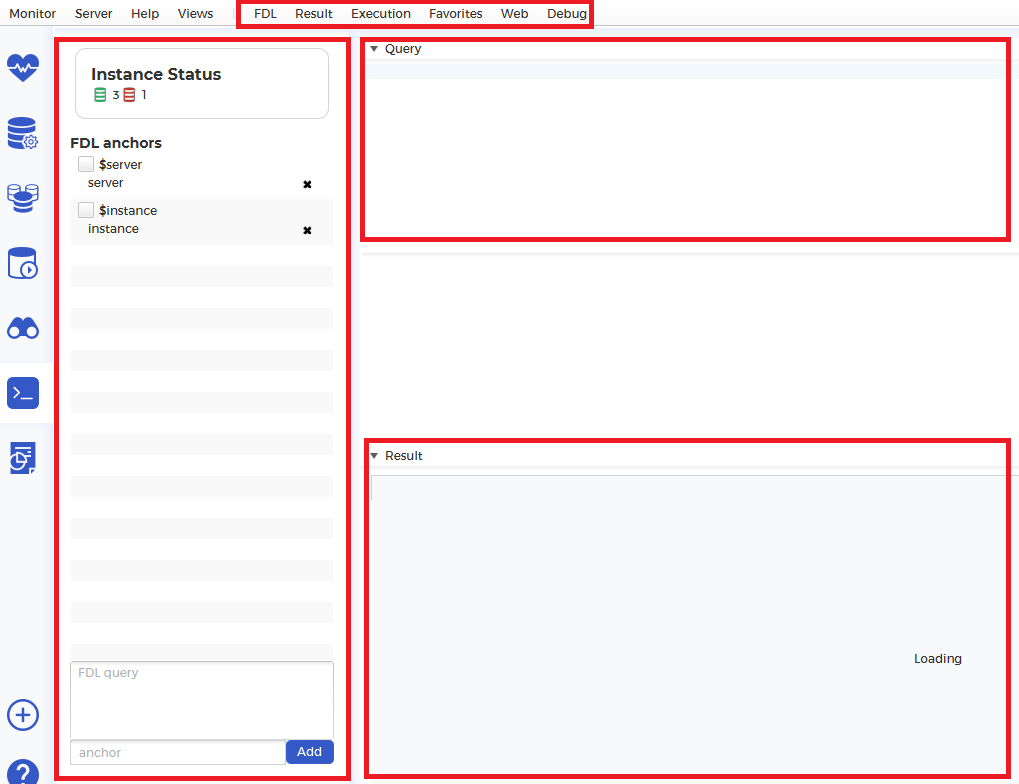
The console consists of 4 main areas and a command bar.
- On the left-hand side, you have the predefined anchors to use in your queries. In Enterprise Manager, it is similar to the “Context area”.
- The topmost part holds all your settings and additional options when executing your FDL. Here you can set the execution as either “Continuous” (automatically triggers written FDL queries) or “Triggered” (manually triggers written FDL queries). You can also open a new FDL Console, change the result page to Table format or Tree format, and debugging.
- Below it is the “Query area”. This is where you enter your FDL queries.
- Underneath the “Query area”, the non-boxed space is where it displays suggestions if you hit the tab key while typing queries or it will display error messages. This is commonly known as “Information Area”.
- The bottom-most area is the “Result area’. This is where the results of FDL queries are displayed.
By default, the FDL console operates in “Continuous”, which means that queries are executed on the fly as you type. You can change this to “Triggered” on the “Execution” menu. Then queries will only be executed when you press “Ctrl + E”.
dbWatch defines a graph of property that we navigate with FDL. Each property can contain other properties or values (values do not contain other properties). We move from one property to the other with the “/” sign.
The start property is the property representing (all) the dbWatch Server(s).
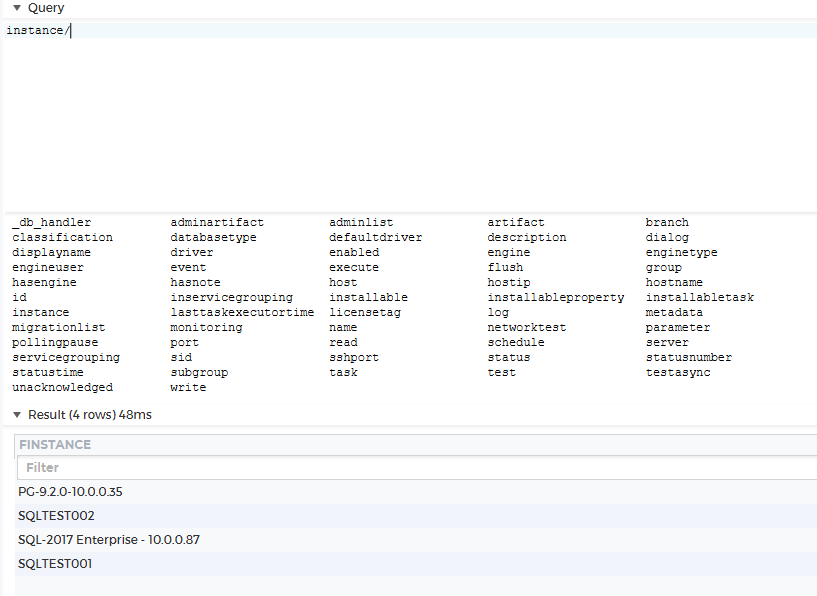
If you type instance in the debug console, you will see a list of all the instances that are registered on your dbWatch Servers.
In the example below, I typed Instance/name to return the given names of each instance. If I typed instance instead, it will return the registered id of each instance.

If you add a “/” and hit the tab key, you will see all the entities and values that are available from the instances. Going back to the example below, I used instance instead of the previously written query Instance/name. There are two main reasons for doing so:
- Think of properties as directories. By accessing one directory, you limit or expand the subdirectories associated with that directory. Similarly, properties can only be attributed to another property if there is an association, to begin with.
- Next, the backslash (“/”) and tab key combination is some sort of suggested paths. As mentioned previously, if there is no association with any property then it won’t return any value. Since Instance/name has no property connected to it then it won’t return any result.
Expand the query again by typing “instance/task”. The result will then show a list of all installed tasks (or alerts) on all instances.

As you will observe, the default is that only the last “column” in the query is shown in the result set (in this case task is shown, but not instance). In order to output other “columns”, you can add curly brackets “{}” to the property you want to show. Don’t mind the arrows first. This will be discussed in depth in Anchors
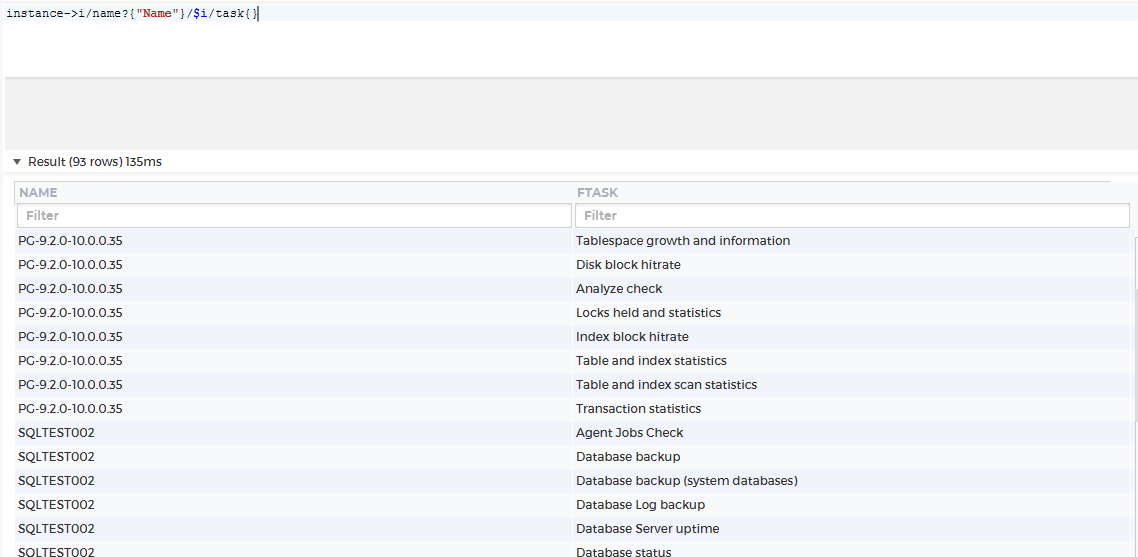
As you can see, the last column (task in this case) is always shown. You don’t need to add a {} at the trailing column (as seen above) but for future edits of your FDL query, it makes it easier to append additional columns. Inside the curly brackets, you can rename any column using aliases. Similar to any query, all alphanumeric characters inside the open and closed brackets will substitute as their column name.
Filters
You can apply filters to the query by adding an expression that evaluates to true/false in square brackets.
In the previous example, we queried for the list of tasks of all registered instances. If we want the tasks of only some of the instances, we can filter on properties of the instances. For example, if we want only PostgreSQL instances that have a name that contains “2.0” in between its name, we could write as follows:
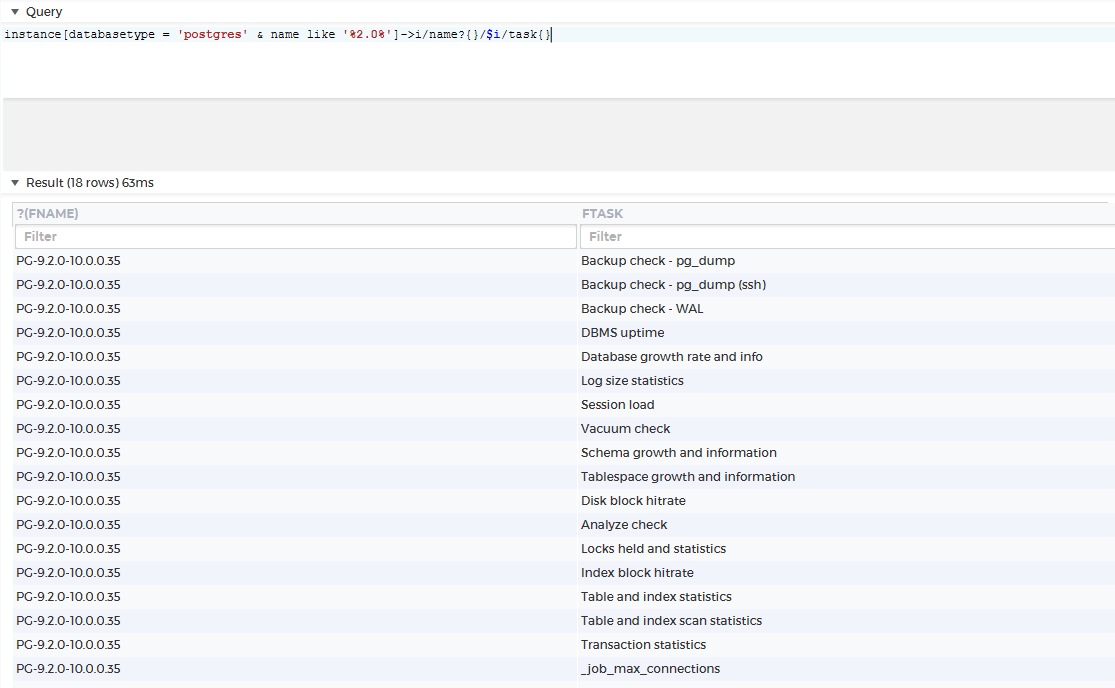
You can add filters to all the columns. So if we want to limit the result further to only tasks that have a name starting with “Backup”, we could do the following

Anchor
What if you want to list several properties from a property? Then we use an anchor. An anchor is defined by “->” and accessed by “$”.
For example, if we want to list the name and status for all alerts on a specific instance we could do the following
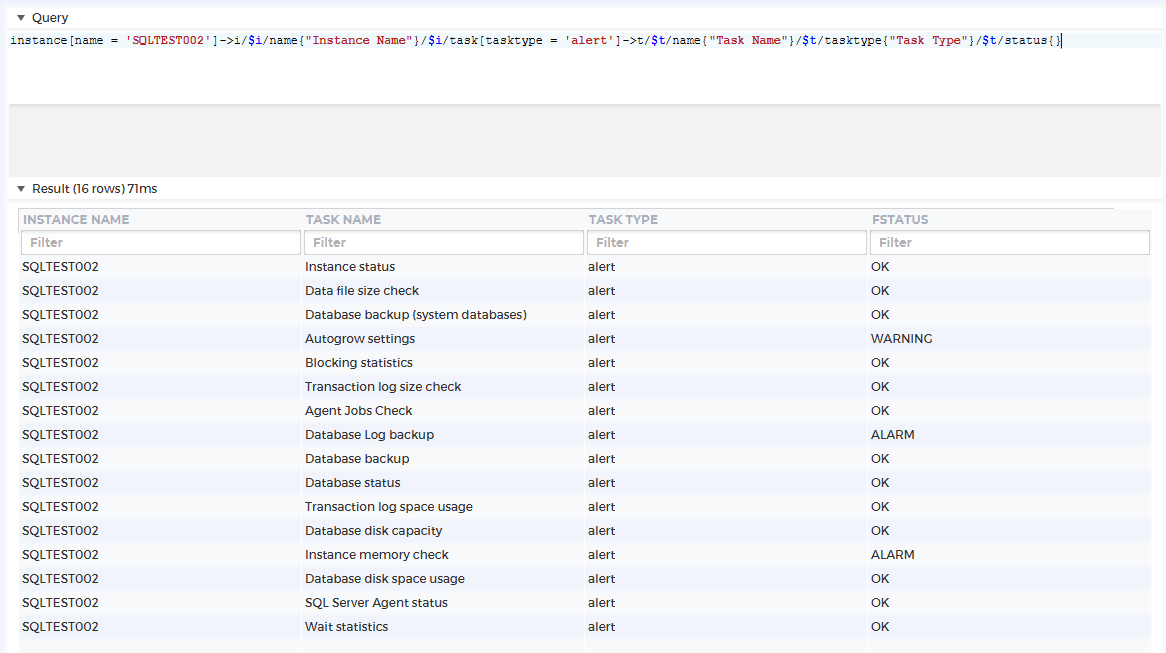
As you can see above, we place all the task (of type alert) belonging to the instance called “SQLTEST02” in an anchor called t, then we can use $t later in the query to reference the task name and status. As seen in previous sections, we also used i as our anchor. It shows how we can use any letter or string of characters as our anchors. For more simplicity, it’s better to avoid very long strings of character, as anchors are supposed to make it easier to refer to a property.
Operators
The following operators are available in the FDL language.
| Operator | Meaning | Example | Description |
|---|---|---|---|
| = | equals | instance[port = 3306] | Can be used in the filter part of a FDL. |
| != | not equals | instance[port != 3306] | Can be used in the filter part of a FDL. |
| < | less than | instance[total_session_count < 50] | Can be used in the filter part of a FDL. |
| <= | less than or equal | instance[total_session_count <= 50 | Can be used in the filter part of a FDL. |
| > | greater than | instance[memory_usage > 300 | Can be used in the filter part of a FDL. |
| >= | greater than or equal | instance[memory_usage >= 300] | Can be used in the filter part of a FDL. |
| ! | inverts a boolean value | instance[!(host like ’192.168.%’)] | Can be used in the filter part of a FDL. |
| & | and | instance[total_session_count < 50 & memory_usage < 100] | Can be used in the filter part of a FDL. |
| | | or | instance[total_session_count < 50 | memory_usage < 100] | Can be used in the filter part of a FDL |
| like | string matching with ‘%’ wildcard | instance[host like ’192.168.%’] | Can be used in the filter part of a FDL. |
| matches | regular expression matching | instance[name matches ‘[O-T].*’] | Can be used in the filter part of a FDL. |
| -> | create anchor | instance->i/$i/name{}/$i/status{} | Creates an anchor of a propery that can be referenced later by prefixing the assigned name with $. |
| {x} | assign column number | instance->i/$i/name{ 0 }/$i/status{ 2 }/$i/host{ 1 } | Postfixing a value with a number between curly braces causes that value to be in the resultset at the column number specified. By default only one column will be produced, containing the last value in the query. |
Examples of FDL queries
Fetch the names of all instances.
instance/nameFetch all tasks on the instance named “Instance one”.
instance[name="Instance one"]/taskFetch all tasks with status Alarm and the corresponding instance name
instance->inst/task[status="ALARM"]{ 0 }/$inst/nameFetch the name of all instances of with a total_session_count above 10 and that are of database type oracle or SQL server.
instance[total_session_count > 10 & (databasetype='oracle' | databasetype = 'sqlserver')]/nameResult rendering
The Debug console can render the query results based on hashtags in the query. These hashtags work as a hint to the GUI and are not part of the FDL language. They will currently have no effect on queries executed in other contexts (f.ex through the CLI.)
The currently available render hashtags are:
| Hashtag | Example | Description |
|---|---|---|
| #rendertext | instance/name{#rendertext} | This is the default rendering. |
| #renderdate | instance/task/lastruntimestamp{#renderdate} | Will attempt to render the value as a time if the value is today, otherwise as datetime (and it will be sorted as an datetime, not string). |
| #rendershortdate | server/started{#rendershortdate} | Will attempt to render the value as a date. |
| #renderfulldate | instance/task/lastruntimestamp{#renderfulldate} | Will attempt to render the value as a datetime (and it will be sorted as an datetime, not string). |
| #renderstatus | instance/task{#renderstatus} | Will attempt to render the value as a status icon. |
| #renderstatusraw | instance/status{#renderstatusraw} | Will attempt to render the value as an untyped status icon. |
| #renderint | instance/db_count{#renderint} | Will attempt to render the value as an integer (and it will be sorted as an int, not string). |
| #renderdecimal | instance/db_count{#renderdecimal} | Will attempt to render the value as a decimal (and it will be sorted as an decimal, not string). |
| #renderpercent | instance/cpuload{#renderpercent(100)} | Will attempt to render the value as percent of the argument (Default 100). (So if your values are in the range 0..1, you could specify #renderpercent(1)) |
| #renderbar | instance{}/buffer_miss_pct{#renderbar(100) #warning(70) #alarm(90)} instance{}/buffer_miss_pct{#renderpercent #renderbar(100) #labelwidth(100)} | Will attempt to render the value as a bar. The argument is max value (default 100), with no warning/alarm threshold set. Adding #warning and/or #alarm with arguments in percent will cause the bar to be colored red,orange,green based on theese thresholds. Can be combined with renderint/decimal/percent and an optional labelwidth |
| #renderboolean | instance{}/hasnote{#renderboolean #iconfalse #icontrue(document.png)} | Excpects a true/false value and will render the values as icons. The default icons can be overridden by specifying #iconfalse/#icontrue. Specifying no argument (like #iconfalse in the example), will result in no icon being displayed. Specifying an icon file (like #icontrue(document.png), will result in that icon being used. (Feature available from version 12.1.5) |
| #headericon | instance/hasnote{#headericon(editscript.png)} | Will display the specified icon as the column header |
| #renderraw | instance{#renderraw}/db_count | Will show the instance column as rawdata and not a “nice” string. |
| #sort | instance{#sort(asc)} | Will sort the result on this column. Default is descending. Legal arguments are ‘asc’ and ‘desc’. |
| #width | instance/displayname{#width(120)} | Will cause the displayname column to be restricted to a width of 120px. |
| #fit | instance/started{#fit(xx.xx.xxx xx xx xx)} | Will cause the instance column to be wide enough to display the specified text. Normally the column is wide enough to display the column header text. The #fit tag makes room for the specified text instead. |
| #hide | instance{#hide}/name | Will hide the column from the result. |
| #owner | instance{#owner}/name | This value will be used to create the correct menu when right clicking on a row. |
| #id | instance{#id}/name | This value will be used as an index when optimizing the updating of the result table. |
FDL terminology
property
A dbwatch property identifies a resource. Dbwatch properties consist of a property type, id, and context.
Represented as a string property can look like this;
- “instance:My database@server:My server” or
- “user:Jack@securitycontext:default@server:My server”
Topic
A topic is a semantic description of an edge in the semantic graph. Dbwatch comes with a set of predefined topics. It is also possible to define new topics to fit your enterprise needs.
Post your comment on this topic.