Tree navigation
On the left side of the dbWatch monitor, you will see a tree structure. There are 2 component that lets your group and filter instances.

Top level of the tree, there is a “Grouping” panel. Below it is a quick text based filter.
Grouping
This is always set to “Default” but you can select a grouping appropriate for monitoring activities. To select a predefined grouping, click the drop down panel and click the grouping of your choosing. Aside from selecting a predefined grouping, you can create new grouping definition as we shall see shortly.
Group by
The group by panel contains a list of properties that the instances in the tree are to be grouped by. In the example above, you see that we are grouping by two properties, server and group. This corresponds to the nodes in the tree. The top node is the Server (we only have one in this case) and on the next level we have the groups (Development, Production and Test).
You can add properties by typing them in the textfield and clicking the plus sign.
For example if we type in “databasetype”, we see that the database types appears as a new level in the tree.

Metadata filter
The metadata filter is more powerful than the simple text filter and allows you to filter instances based on all the properties available on the instance.
In the example below we state that only Oracle instances should be visible.

The lines in the metadata filter correspond to filters that can used in FDL queries for instances (The part in the square brackets). Read more about FDL
To see all the available properties that can be used in the metadata filter, open the FDL Console and type “instance/” and press the tab key.
Text filter
The text filter is not restricted to instance names, all nodes in the tree are considered. For example typing “Back” will remove all branches that do not contain that text. In our case that will leave only instances with an alert named something with “backup”, and also remove all other alerts.
When the tree is a “status tree” (statuses propagate in the tree), the filtering will also result in the propagated statuses changing. For example if an instance has 2 alerts, a backup alert with status warning and a disk space alert with status alarm, the worst status will propagate to the instance (in this case alarm). The if you type “backup” in the filter box, the disk space alert will dissapear and the instance status will change to warning.
The order of the groupings can be rearranged by drag and drop in the list. You can remove them again by right clicking and selecting “Delete”.
You can save the new grouping definition by clicking “Save”, it will then replace the definition selected in the dropdown on the top.
You can save it as a new definition by clicking “Save as” and typing in a new name.
This dynamic grouping is an extremely powerful feature that allows us to dynamically change your entire view of your environment.
For example, we can remove all the properties (right click on them and click delete) then add “task” (type task in the textbox and hit enter or click “+”).

Now we see that our instances are grouped by what tasks they have installed. For example we can see that only Alderaan has the “Job Scheduling check” installed.
In another example, we group by customer.
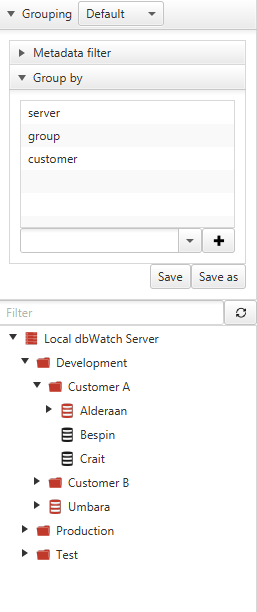
And we see that “Alderaan”, “Besbin” and “Crait” belongs to “Customer A” and another set of instances belongs to “Customer B”. Also notice that instances that do not have a defined customer are grouped directly under the group node.
All properties defined on instances can be used to group by. See the section on the Property System for details.