Installation of SQL Performance package
Requirements for installation
- dbWatch Control Center release 2022-09-29 / 501 or newer
- License that includes SQL Performance module. It can be as the separate “SQL Performance Package” license or as part of a larger licence package. It is included in the DEMO license type.
- Database platform and version that is supported
- Space on the database instance, around 5 GB depending on the amount of SQL queries, configured thresholds and desired history requirements.
Adding the licence
If the database instance is using the DEMO licence type, you can skip this step, as it is already enabled.
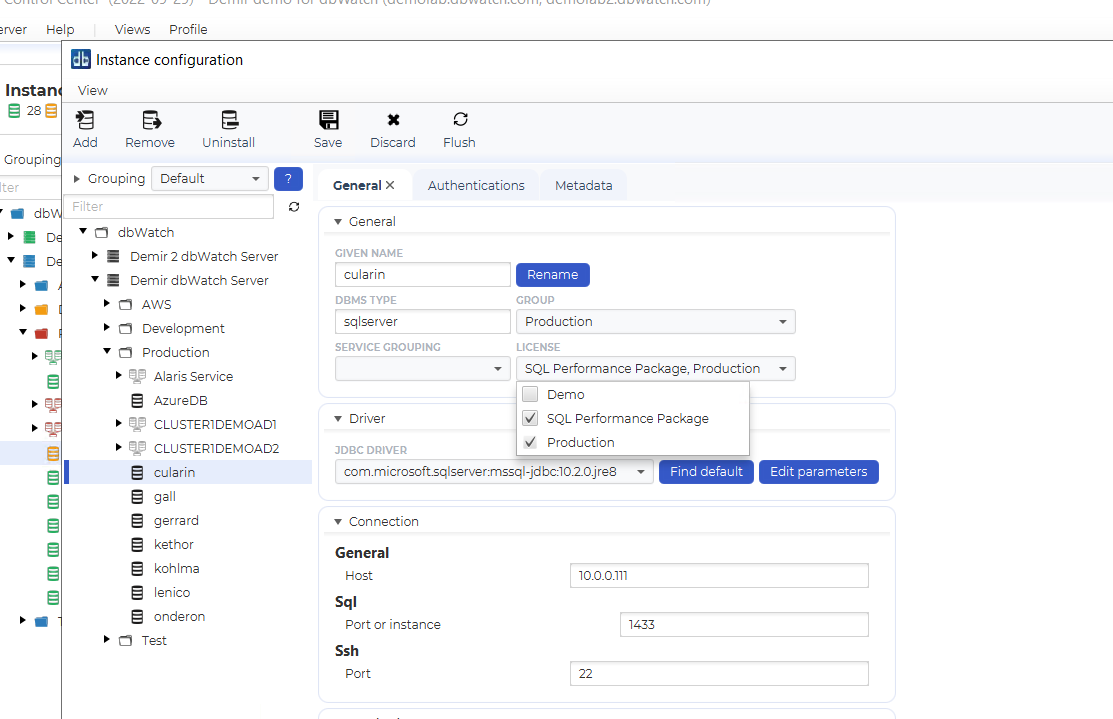
Right click on an instance, choose Configure instance. If you pull down the Licence list, you must make sure a licence that includes the SQL Performance package is chosen. In this case, both Demo and SQL Performance Package is valid choices. After you have made your choices, click “Save” to save changes.
Additional steps for PostgreSQL
The SQL Performance package on PostgreSQL needs some additional steps.
First, make sure you have the following settings in the postgresql.conf file.
track_activity_query_size = 2048
shared_preload_libraries = ‘pg_stat_statements’
pg_stat_statements.track = all
pg_stat_statements.max = 10000
Also in the database instance, add the extension:
CREATE EXTENSION pg_stat_statements with schema public
Installing the SQL Performance package repository job
Once the correct licence is enabled, you can install the job that collects SQL performance data for the repository.
Right click on the instance name, and chose “Configure jobs”
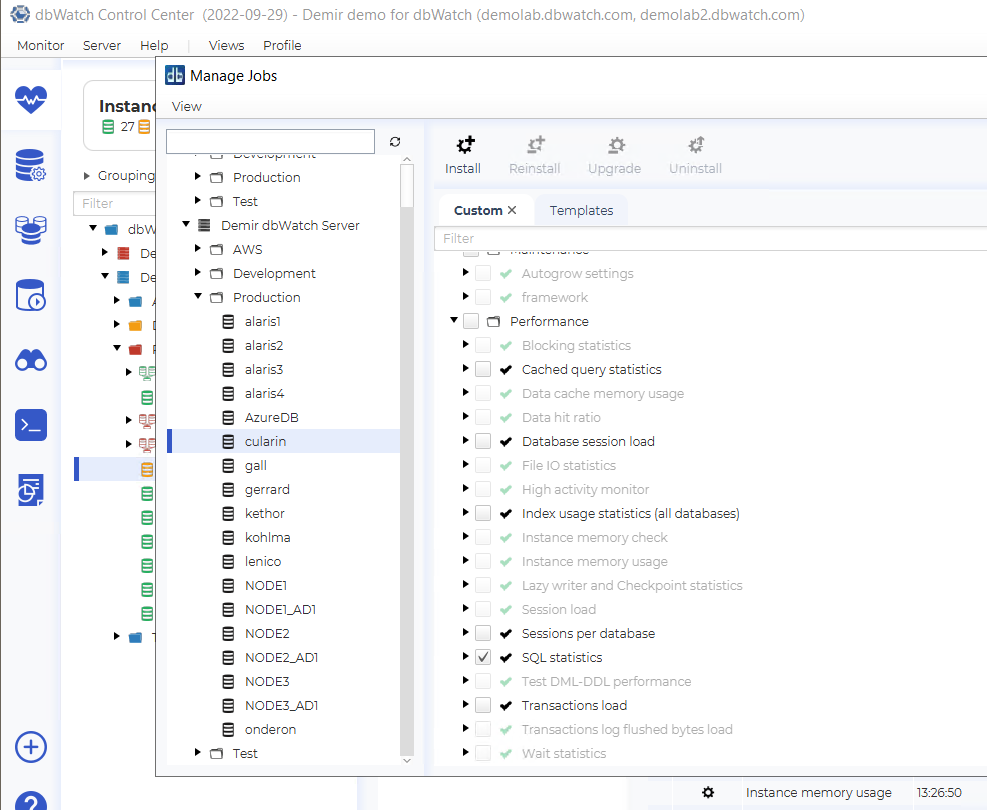
Scroll down to the Performance group, and select the job “SQL statistics”. If it is not available, you have not enabled the correct licence, or the platform/version is not supported. Once selected, click “Install” to install it on that instance. You should get an OK popup. Close the popup and the “Manage jobs” view.
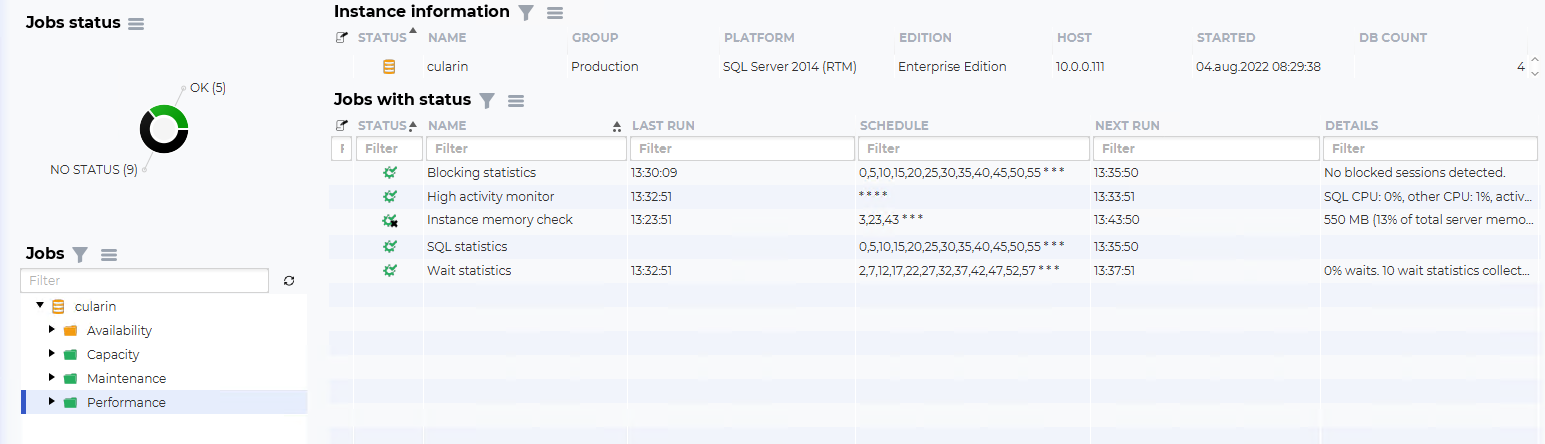
It should now be available in the Performance group on that instance. It will run automatically every 5 minutes by default, and can be triggered manually if you right click and choose “Run”. Allow it to gather data for some time, such as one day.