Top Menu Overview in dbWatch Control Center
The top menu in dbWatch Control Center provides quick access to core functionality, user preferences, and diagnostic information.
By default, the menu consists of the following entries:
- Monitor
- Server
- Help
- Views
- Profile
Additional menu items may appear depending on which module is currently active.
Monitor, Server and Views are documented in other chapters. This page provides additional details for the Help and Profile menus.
Help Menu
The Help menu offers links, logs, notifications, diagnostic tools, and support options relevant to dbWatch Control Center operations.
The Help menu contains the following submenus:
Help
Opens the dbWatch CC online documentation.
This links directly to the up-to-date product documentation available on the dbWatch website.
Error Log
Displays detailed information related to dbWatch CC operations.
The log includes technical messages, warnings, and error details that may be useful for troubleshooting, support cases, or internal diagnostics.
Notifications
Shows published notifications from dbWatch Control Center.
These may include system messages, alerts, task information, or administrative notices.
Remote Support
Provides access to dbWatch remote support functionality.
For more details, see:
This link describes how to activate remote support sessions, what information is shared, and how dbWatch engineers can assist during troubleshooting.
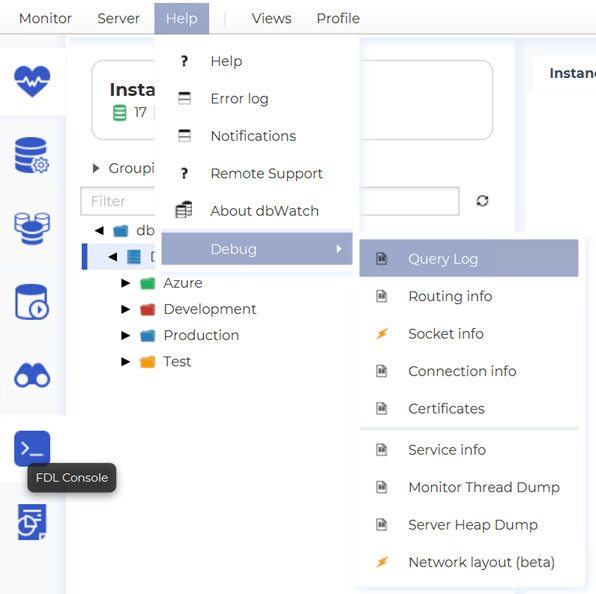
Debug
The Debug submenu contains a set of diagnostic tools and system introspection views intended for advanced troubleshooting.
These tools provide insight into routing, network communication, sockets, certificates, service behavior, and execution paths.
The Debug submenu includes:
- Query Log
- Routing Info
- Socket Info
- Connection Info
- Certificates
- Service Info
- Monitor Thread Dump
- Server Heap Dump
- Network Layout (beta)
Network Layout (beta) shows a graphical display of your dbWatch network, including server relationships and connection paths.
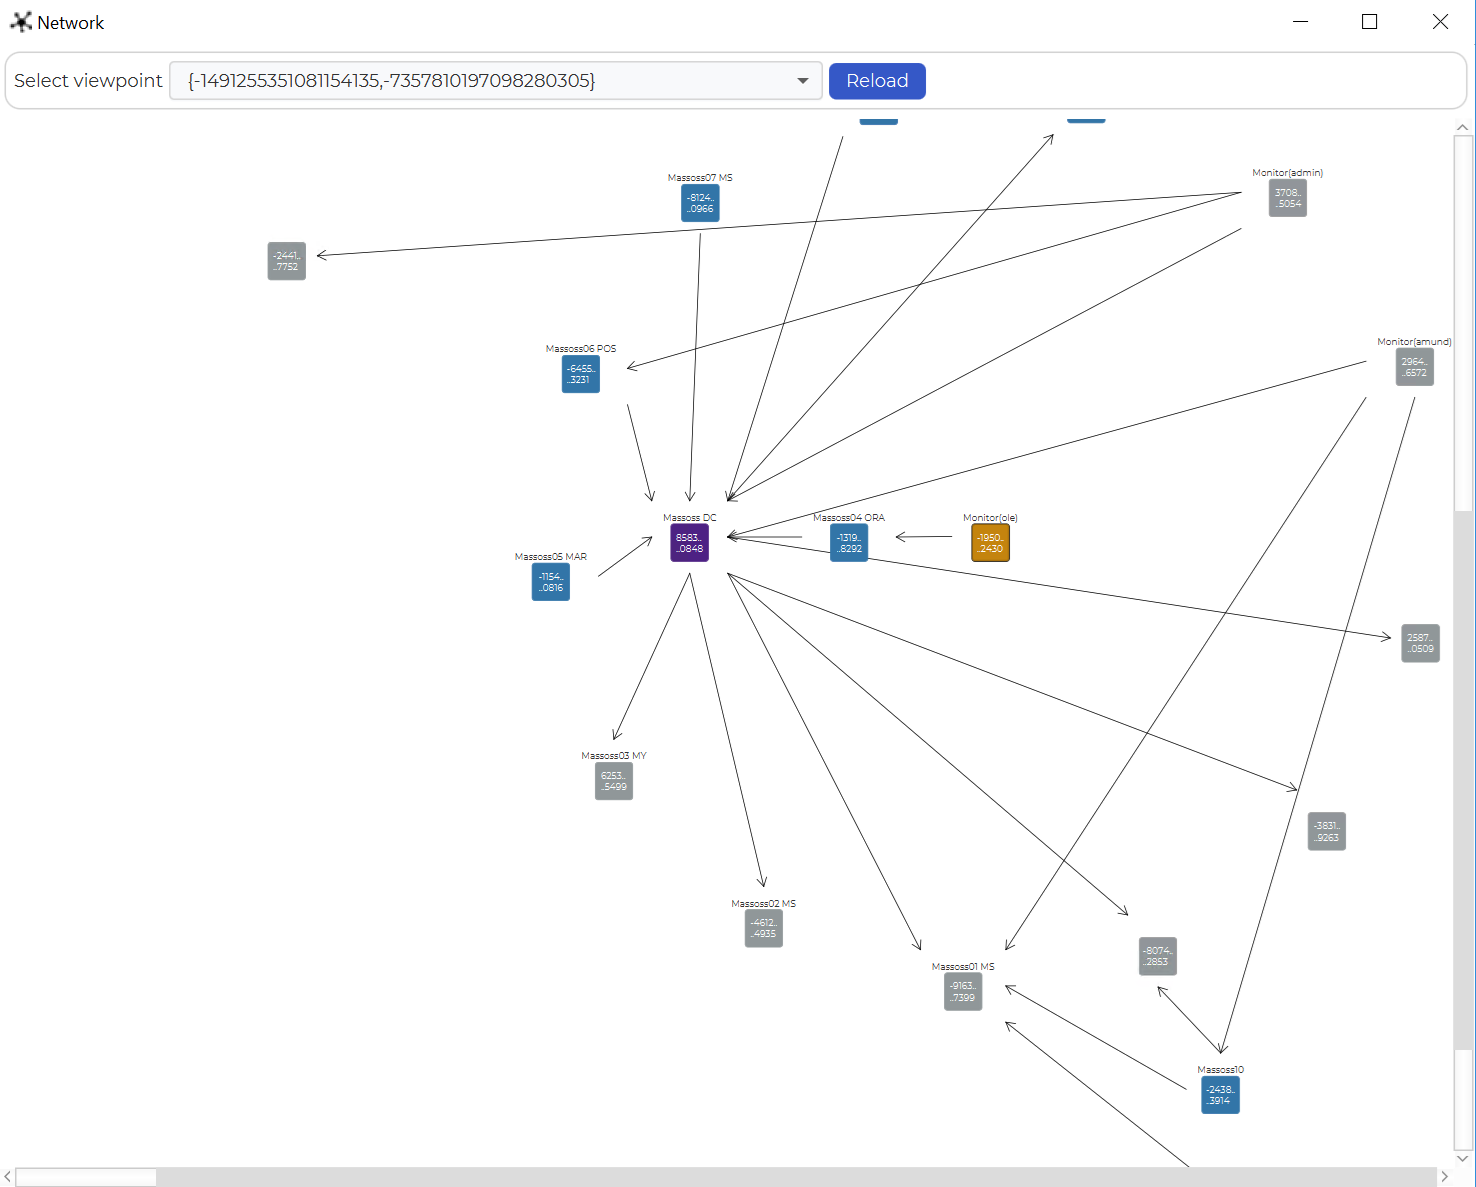
These tools are primarily intended for advanced users, support engineers, or environments where deeper system-level inspection is required.
Profile Menu
The Profile menu contains user-specific options related to monitoring layout, authentication, and preferences.
The Profile menu includes the following submenus:
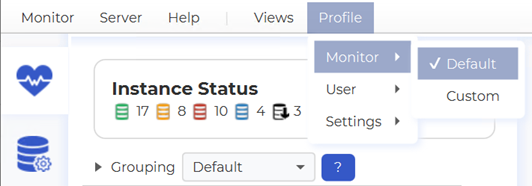
Monitor
Contains two options:
- Default
- Custom
Selecting Custom allows the user to define their own Monitor tabs and layout.
This is useful when you want to tailor the Monitor dashboards to specific operational needs or workflows.
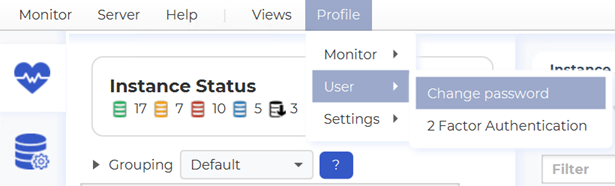
User
The User menu provides access to security and authentication settings:
- Change Password
- 2-Factor Authentication
These options allow users to update credentials and enhance account security through two-factor verification.
Settings
The Settings menu contains user-level preferences.
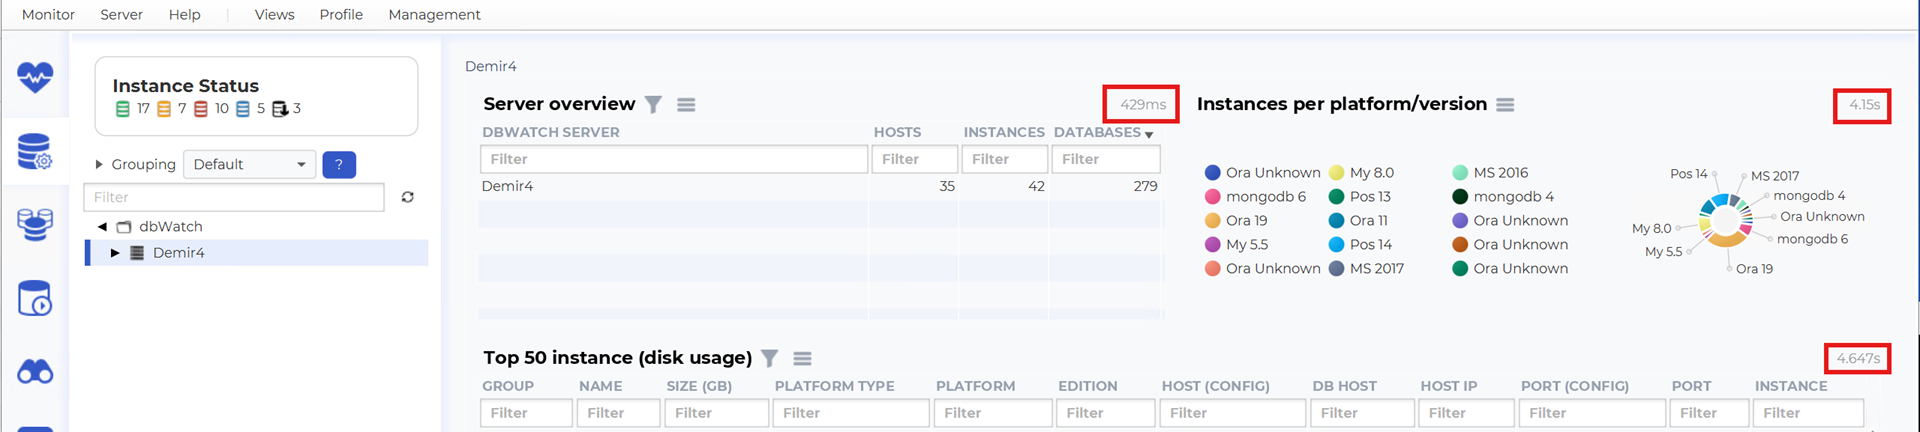
Currently it includes the option Show execution time
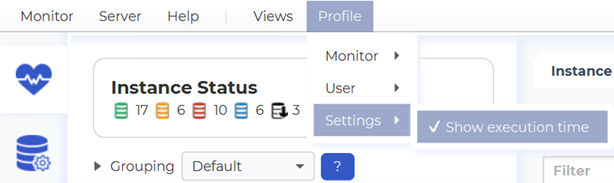
When enabled, dbWatch Control Center will display the execution time of queries used to generate views and reports.
This is useful for monitoring system responsiveness, understanding module performance, and optimizing database operations.